$ANET DCF valuation model
A detailed review of the key inputs underpinning the discounted cash flow for this remarkable compounder

Arista has been a wonderful growth story for shareholders, with an impressive 42% return over the past 10 years. That’s genuinely remarkable! But for us investors it’s important to consider what lies ahead. Can Arista continue to outperform the index? Let’s take a closer look to find out.
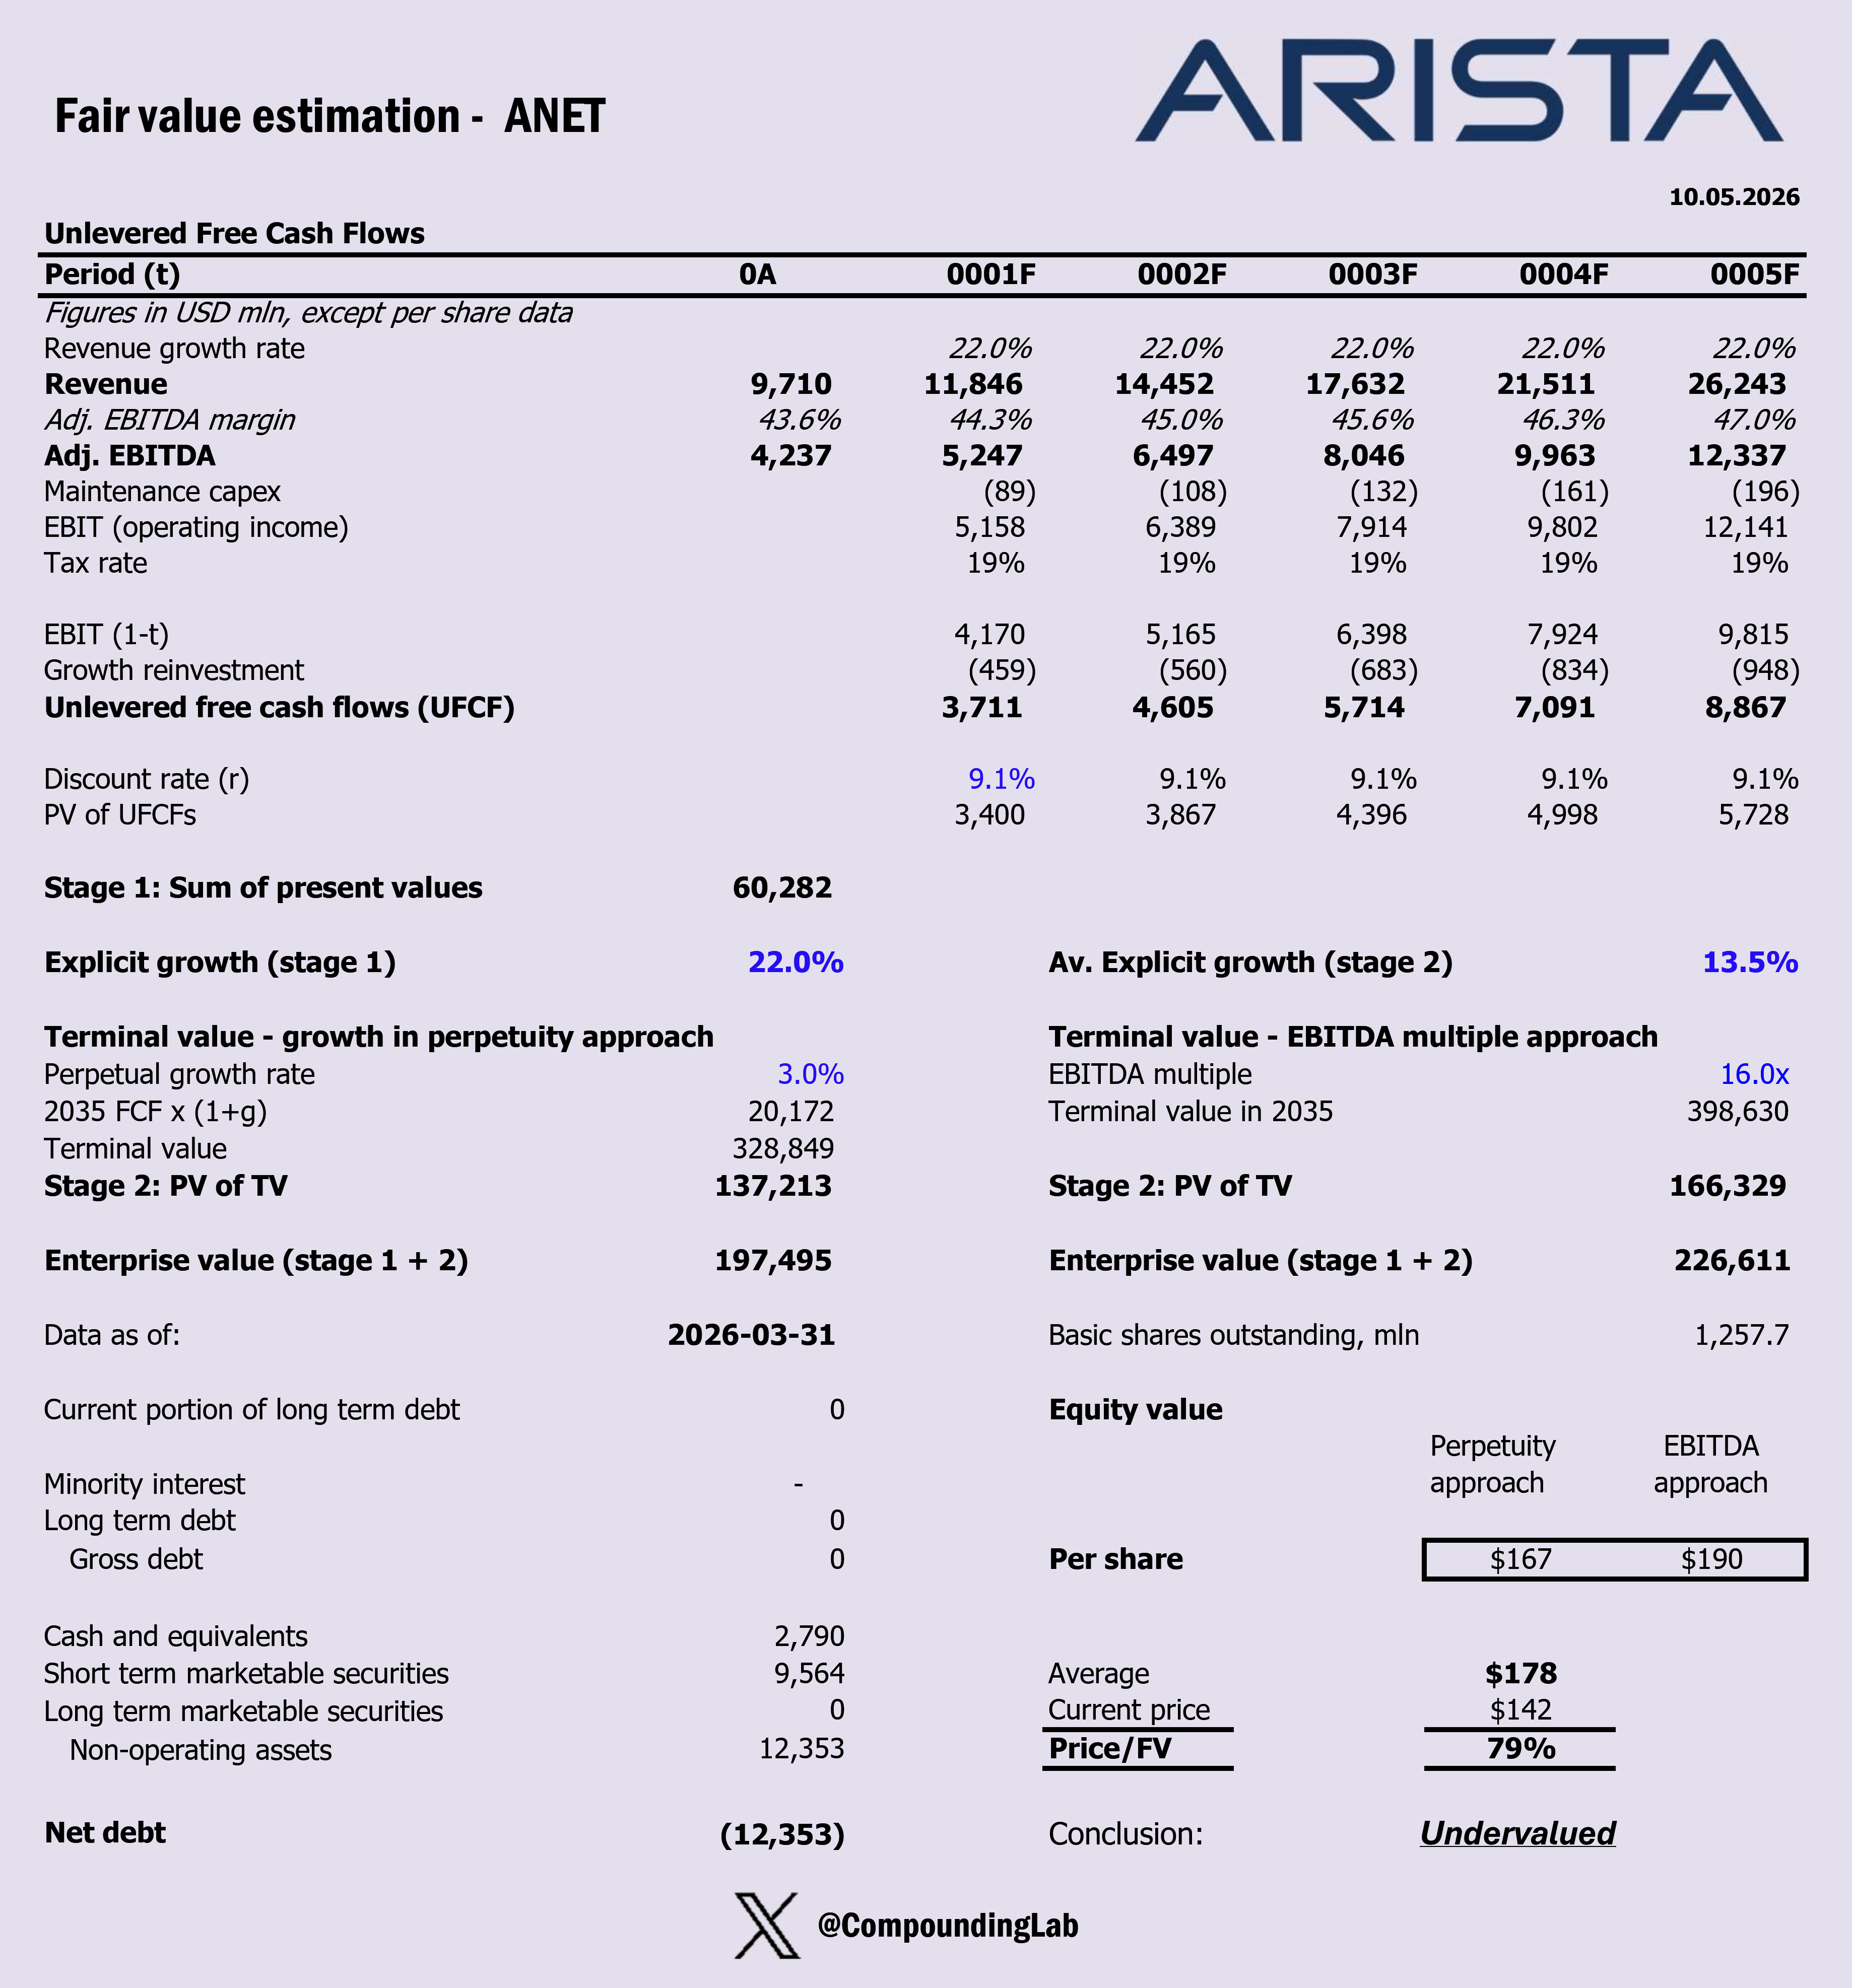
Key assumptions:
Explicit average 5Y/5Y growth @ 22%/13.5%
Long-term growth in perpetuity @ 3%
EBITDA Margin expansion by 0.7% every year until the end of explicit period
WACC @ 9.1%.
Adj. EBITDA exit multiple of 16
Tax rate 19% - in line with historical average
The input that drives reinvestment is Sales to Capital ratio = 5.7
Below I present a detailed explanation of the key inputs underpinning my DCF model.
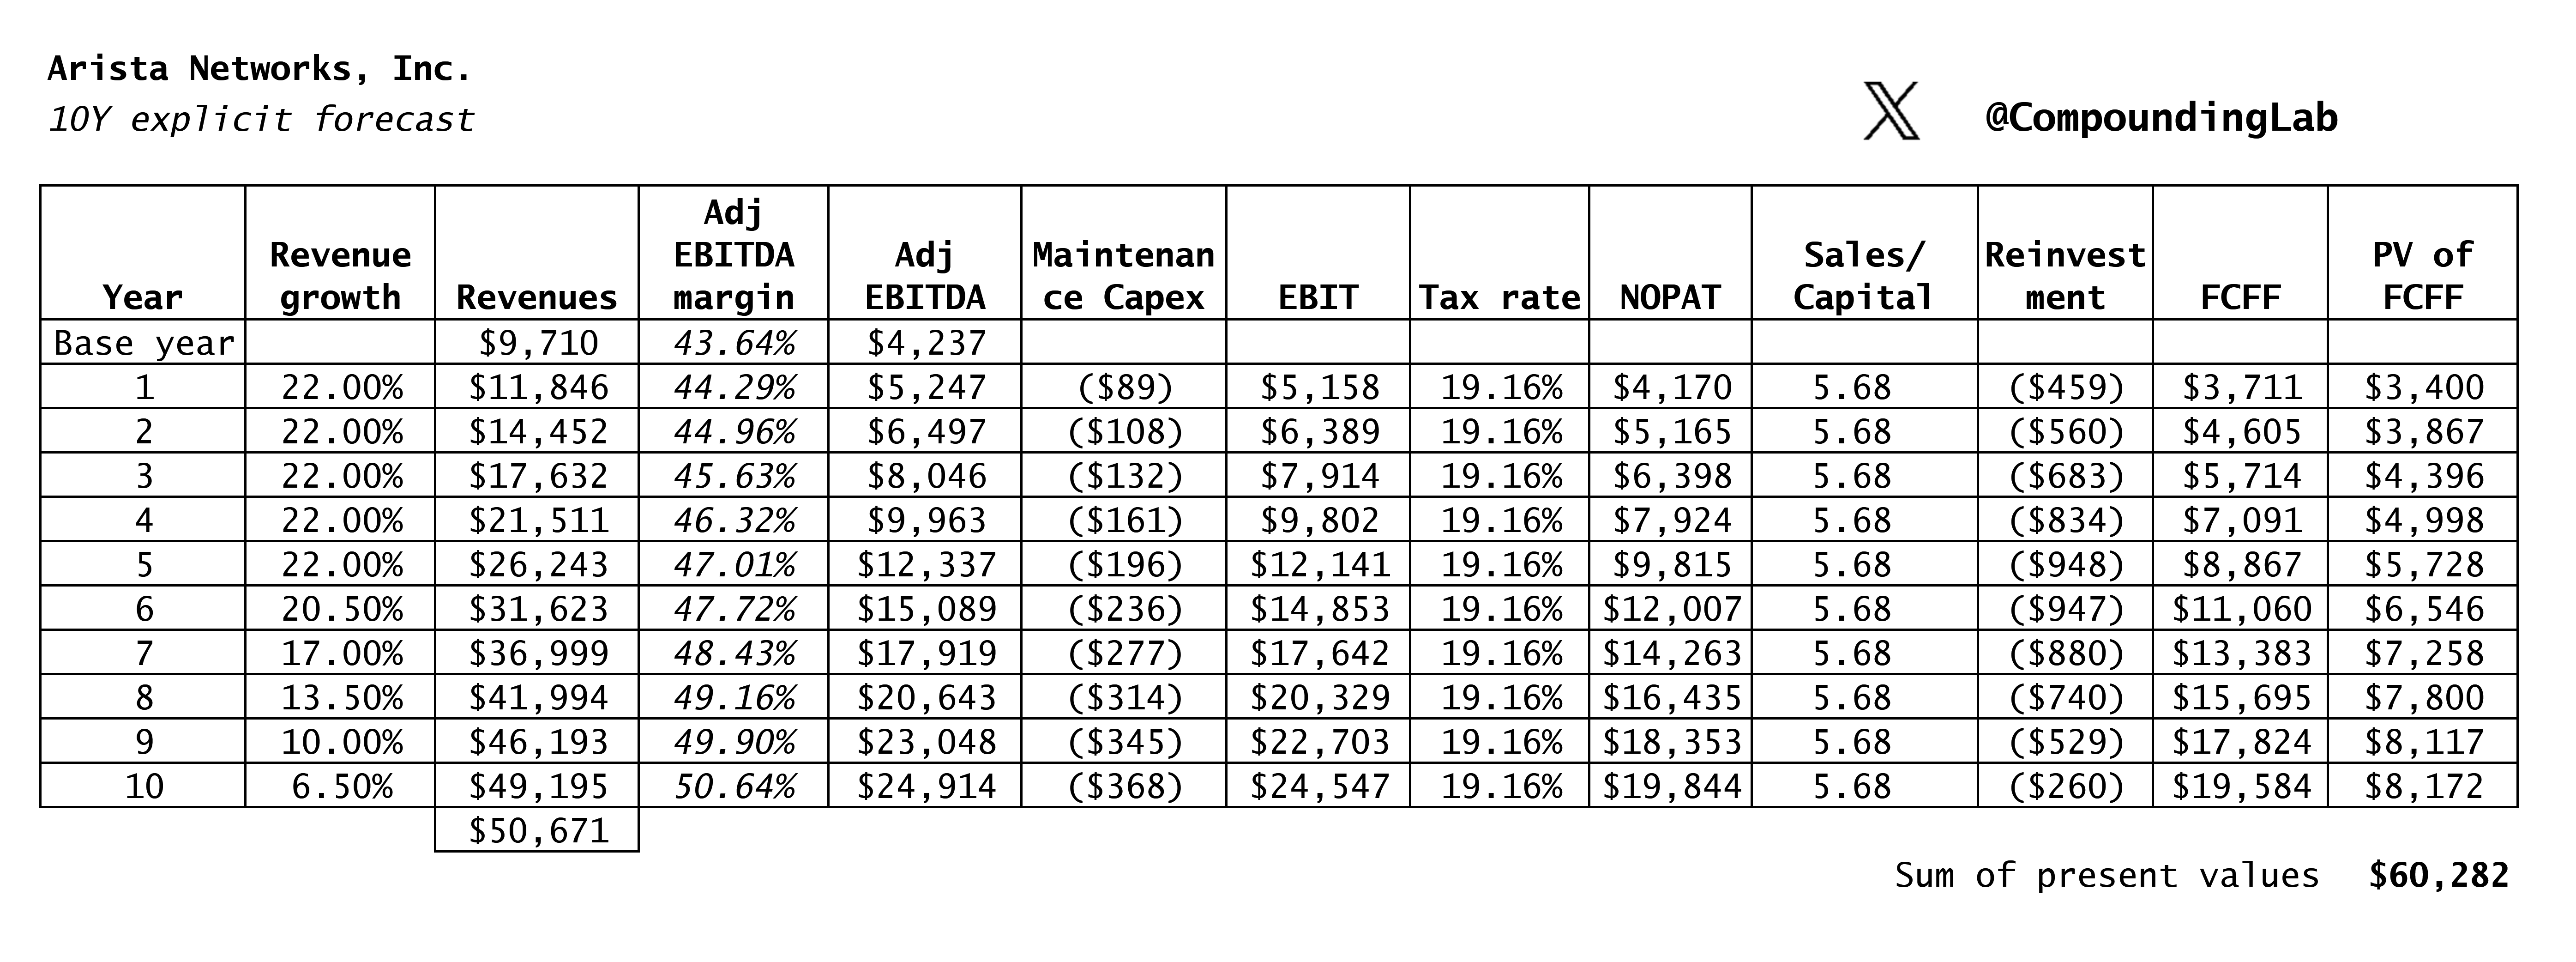
1. Explicit Revenue Growth: 22% (Years 1-5) and 13.5% (Years 6-10)
Since its 2014 IPO, Arista has demonstrated a rare ability to pair hypergrowth with exceptional profitability.
Arista delivered 28.6% revenue growth in fiscal year 2025, reaching $9.0 billion, following 19.5% growth in 2024 and 33.8% in 2023. For fiscal 2026, management has guided to approximately 25% growth, targeting revenues in excess of $11 billion. The 22% near-term assumption therefore reflects a modest discount to both the historical realised rate and the company’s own guidance. At CL we see it as appropriate given the model’s ten-year horizon and the need for conservative anchoring in the outer years of the explicit period.
The deceleration to 13.5% in years six through ten reflects the natural, expected consequence of compounding at scale. By year six, Arista will be a materially larger business - potentially approaching $25 billion in annual revenues. Therefore, it is reasonable to assume that the law of large numbers will exert gravitational pressure on the percentage growth rate even as the absolute dollar increments remain substantial. Thirteen and a half percent is still approximately four to five times the long-run nominal GDP growth rate, a premium consistent with a business that will continue gaining market share and expanding into adjacent verticals during this phase, but at a more measured pace than in the early stages of the AI infrastructure buildout.
2. Long-Term (Terminal) Growth Rate @ 3%
The 3% perpetuity growth rate anchors the terminal value to a durable, theoretically disciplined steady state.
At the end of the explicit forecast period, our model assumes Arista has matured into a company that grows in line with long-run nominal GDP - capturing no further market share, no more benefiting from new structural tailwinds, and simply compounding with the broader economy. We calibrated this to nominal GDP growth in Arista’s primary markets (predominantly the United States, which accounts for over 80% of revenues), incorporating a real growth component of approximately 1.5-2.0% and a long-run inflation premium consistent with FED targets.
Our conservatism is deliberate: terminal value is the most mechanically sensitive input in any DCF, and anchoring it to an economically grounded rate helps resist the temptation to embed structural outperformance in perpetuity. In fact, we derive 69% of enterprise value from a terminal, which is conservative for a high-growth company like Arista.
3. EBITDA Margin Expansion: +0.7 pp per year
Arista’s historical margin trajectory provides the empirical foundation for this assumption, and the operating economics of the business justify its continuation.
Arista’s adjusted EBITDA margin has expanded consistently from 19% in 2025 to 44% in 2025, a level few technology companies of comparable scale achieve. This serves as evidence of structural operating leverage embedded in the business model.
That operating leverage is the mechanism driving the assumed margin expansion. Arista’s cost base contains meaningful fixed and semi-fixed components such as R&D investment, the EOS operating system, platform engineering, and senior talent. Such costs do not scale proportionally with revenue. As revenues continue to compound, each incremental dollar flows through at a higher marginal rate, mechanically expanding profitability. The growing mix of software and services revenues provides an additional tailwind.
A rate of 0.7 percentage points per annum is lower than historical expansion. That’s because Arista is simultaneously absorbing cost pressures on two fronts. First, the campus networking expansion requires incremental sales and marketing investment to penetrate a market where Cisco has historically been the entrenched incumbent. Second, the AI networking opportunity demands continued R&D acceleration in areas including 800G and 1.6T switching platforms, AI spine-and-leaf architectures, and the Ultra Ethernet Consortium specification. Without this investments, it will be difficult to maintain technological leadership against well-funded competitors including Nvidia, Broadcom, and HPE/Juniper.
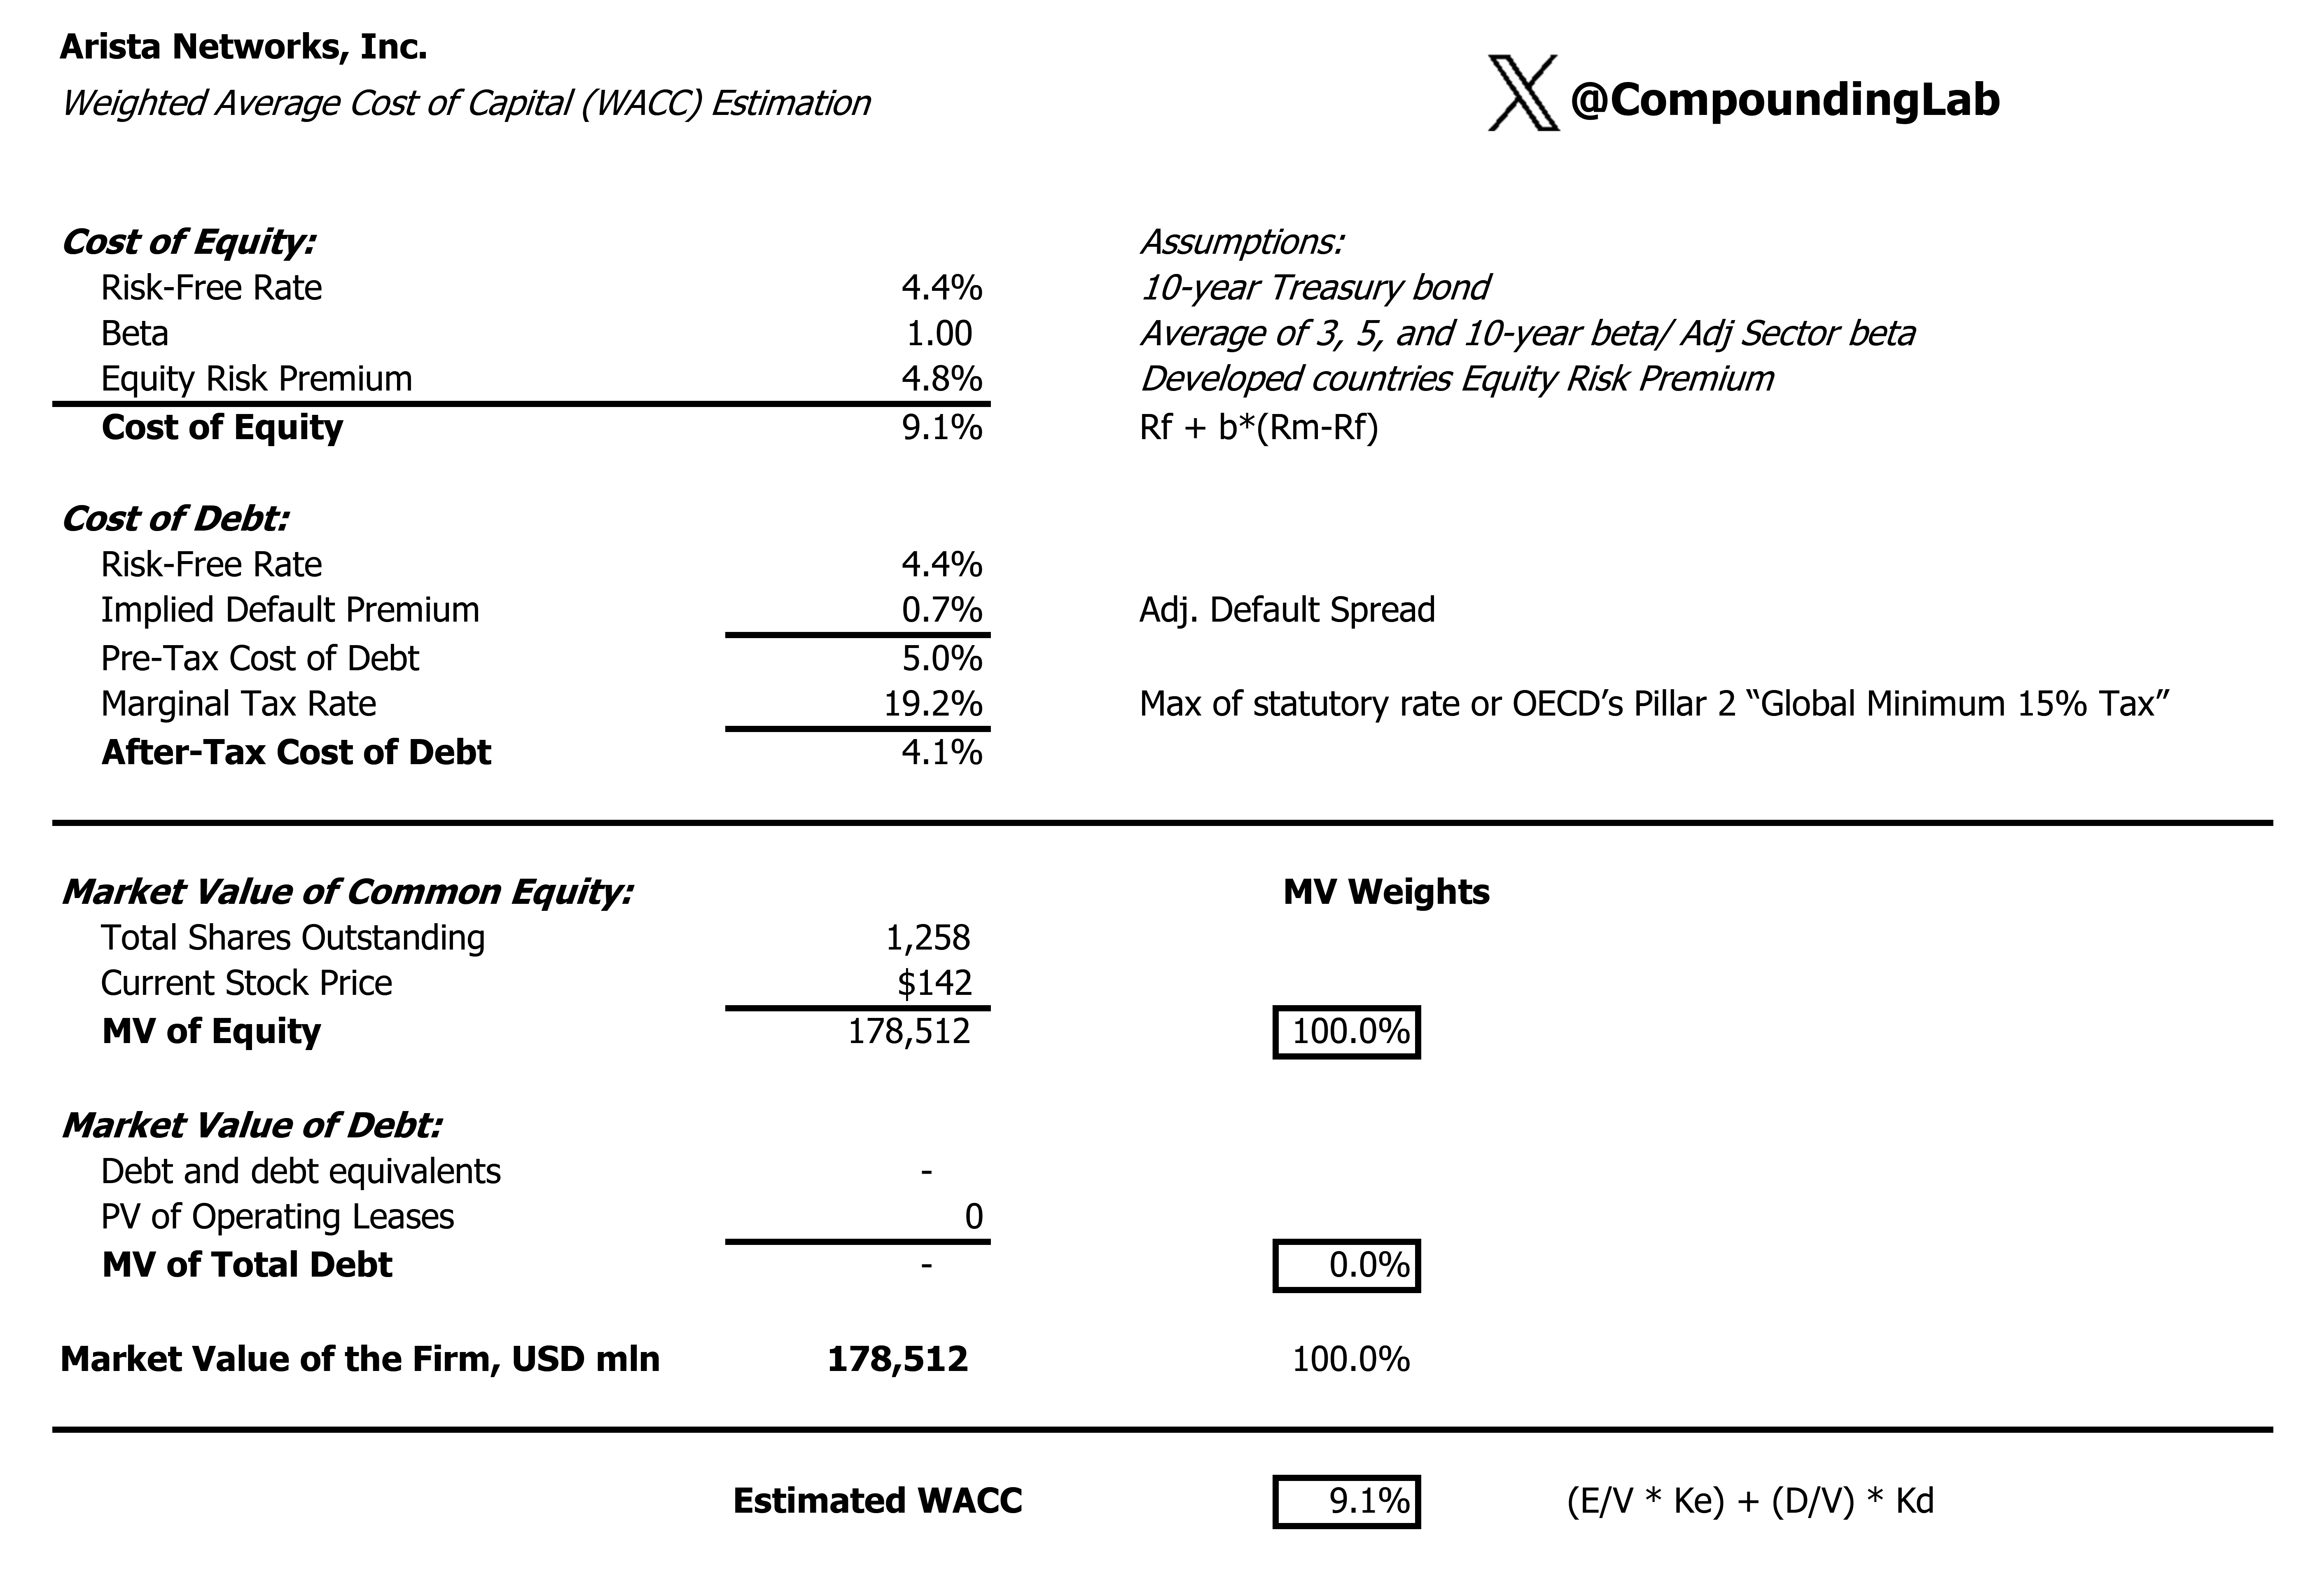
4. WACC: 9.1%
We believe a WACC of 9.1% is a defensible estimate for Arista. It sits in the upper portion of the range produced by standard CAPM constructions while reflecting the company’s genuine risk profile.
Third-party estimates of Arista’s WACC vary meaningfully, from approximately 7.2% (using a lower beta assumption and conservative equity risk premium) to approximately 11.7% (using a beta calibrated over a shorter, more volatile period). The 9.1% selected here represents a considered midpoint, derived from a risk-free rate in line with prevailing long-duration US Treasury yields, an equity risk premium of 5.0%, and a beta of 1.0. We embedded this lower than historical beta on purpose since company is becoming a larger and more stable company, although with significant exposure to hyperscaler capital expenditure cycles and the associated lumpiness in order timing.
Arista carries no long-term debt and holds approximately $10 billion in cash, cash equivalents, and investments. This fortress balance sheet means the WACC is almost entirely the cost of equity. In practice, this is a strength: the company has no refinancing risk and no covenants that could constrain strategic flexibility. But it also means the discount rate is not artificially compressed by tax shields on cheap debt, making our assumption equity-anchored.
As a cross-check: the spread between the WACC of 9.1% and the terminal growth rate of 3% implies a terminal year capitalisation rate of 6.1%. This is consistent with the EBITDA exit multiple approach (see below) and does not produce a terminal value that defies economic intuition.
5. Adj. EBITDA Exit Multiple: 16x
An exit multiple of 16× adjusted EBITDA serves as the market-based cross-check on the perpetuity-derived terminal value, ensuring the intrinsic valuation is anchored to observable pricing signals.
The 16× figure is grounded in three reference points. First, comparable publicly traded networking and infrastructure software companies with comparable margin profile. Second, precedent M&A transactions in the broader enterprise networking and cloud infrastructure space provide a deal-premium-adjusted comparator that broadly corroborates the 16× anchor. Third, and most importantly, the multiple is validated by its internal consistency with the DCF terminal value: at a WACC of 9.1% and terminal growth of 3%, the perpetuity approach implies a terminal EBITDA multiple very close to 16×, confirming that the two methodologies converge rather than contradict.
6. Tax Rate: 19%
The 19% effective tax rate is calibrated to Arista’s historical experience rather than the US statutory corporate rate of 21%, and is structurally well-supported.
Arista’s historical average tax rate had run at approximately 16%, somewhat below the 19% modelled here. The model uses 19% as a normalised central case to provide a buffer against potential legislative changes to R&D capitalisation rules, changes in the jurisdictional mix of profits, or a gradual reduction in the stock-based compensation tax deduction as the company matures and its options pool normalises.
The divergence from the statutory rate is structurally explicable. Arista benefits from R&D tax credits applied against its substantial and sustained investment in product development. This permanently reduce taxable income recognised by the US tax code in these situations. Stock-based compensation, while a significant expense, generates deferred tax assets that create a persistent wedge between the accounting charge and cash taxes paid. The geographic distribution of revenues is predominantly US-based, with international operations constituting only 20% of revenues. This limits the benefit of lower-rate offshore jurisdictions, keeping the effective rate above what some more globally distributed peers achieve. At 19%, our model applies a sensible, cycle-neutral tax assumption that neither flatters the company nor punishes it.
7. Sales-to-Capital Ratio: 5.7x
This is an interesting one. All our models are based on Sales/Capital ratio even though sometimes it’s not a straightforward task to figure out the correct ratio to be applied. In this case, 5.7x reflects the fundamentally asset-light character of Arista’s business. When calculating appropriate rate, we had excluded short-term investments because they naturally have lower ROIC than Arista’s core business. If you look at the traditional Sales/Capital ratio on most websites, you will see a much lower figure because it includes such investments in the denominator, thus deflating the Sales/Capital ratio.
To grow revenues at the rates embedded in the explicit forecast, Arista must reinvest capital in engineering talent, product development, sales infrastructure, and modest amounts of physical plant. The question is how efficiently it converts that investment into revenue. Arista’s capex requirements historically have been low. For example, in 2025, the company generated $4.3 billion in free cash flow on revenues of $9.0 billion, with capital expenditure that is minor relative to its revenue base. Its return on invested capital of approximately 22% is among the highest in the technology hardware sector and confirms that every dollar reinvested generates returns far in excess of the cost of that capital.
A ratio of 5.7x means that for every $5.70 of additional annual revenue, Arista needs to deploy $1.00 of net new capital. This is consistent with a business whose primary productive assets are intangible, such as EOS (its proprietary network operating system, which runs across the entire installed base and creates deep switching costs). Their accumulated engineering know-how and customer relationships forged over years of mission-critical deployments at hyperscalers including Microsoft, Meta, and Google. These assets do not depreciate in the traditional sense; they appreciate as the installed base grows and the software ecosystem around EOS deepens. Physical capital requirements are genuinely modest: Arista is a fabless hardware company, outsourcing semiconductor fabrication and, increasingly, relying on merchant silicon from Broadcom and custom ASICs whose development costs are shared with hyperscaler partners.
We derived 5.7x ratio from Arista’s own normalised capital efficiency, cross-referenced against its closest peers in the enterprise networking and cloud infrastructure space and applied it consistently across both phases of the explicit period. It generates implied returns on incremental capital that remain substantially above the 9.1% cost of capital, consistent with the empirical evidence.
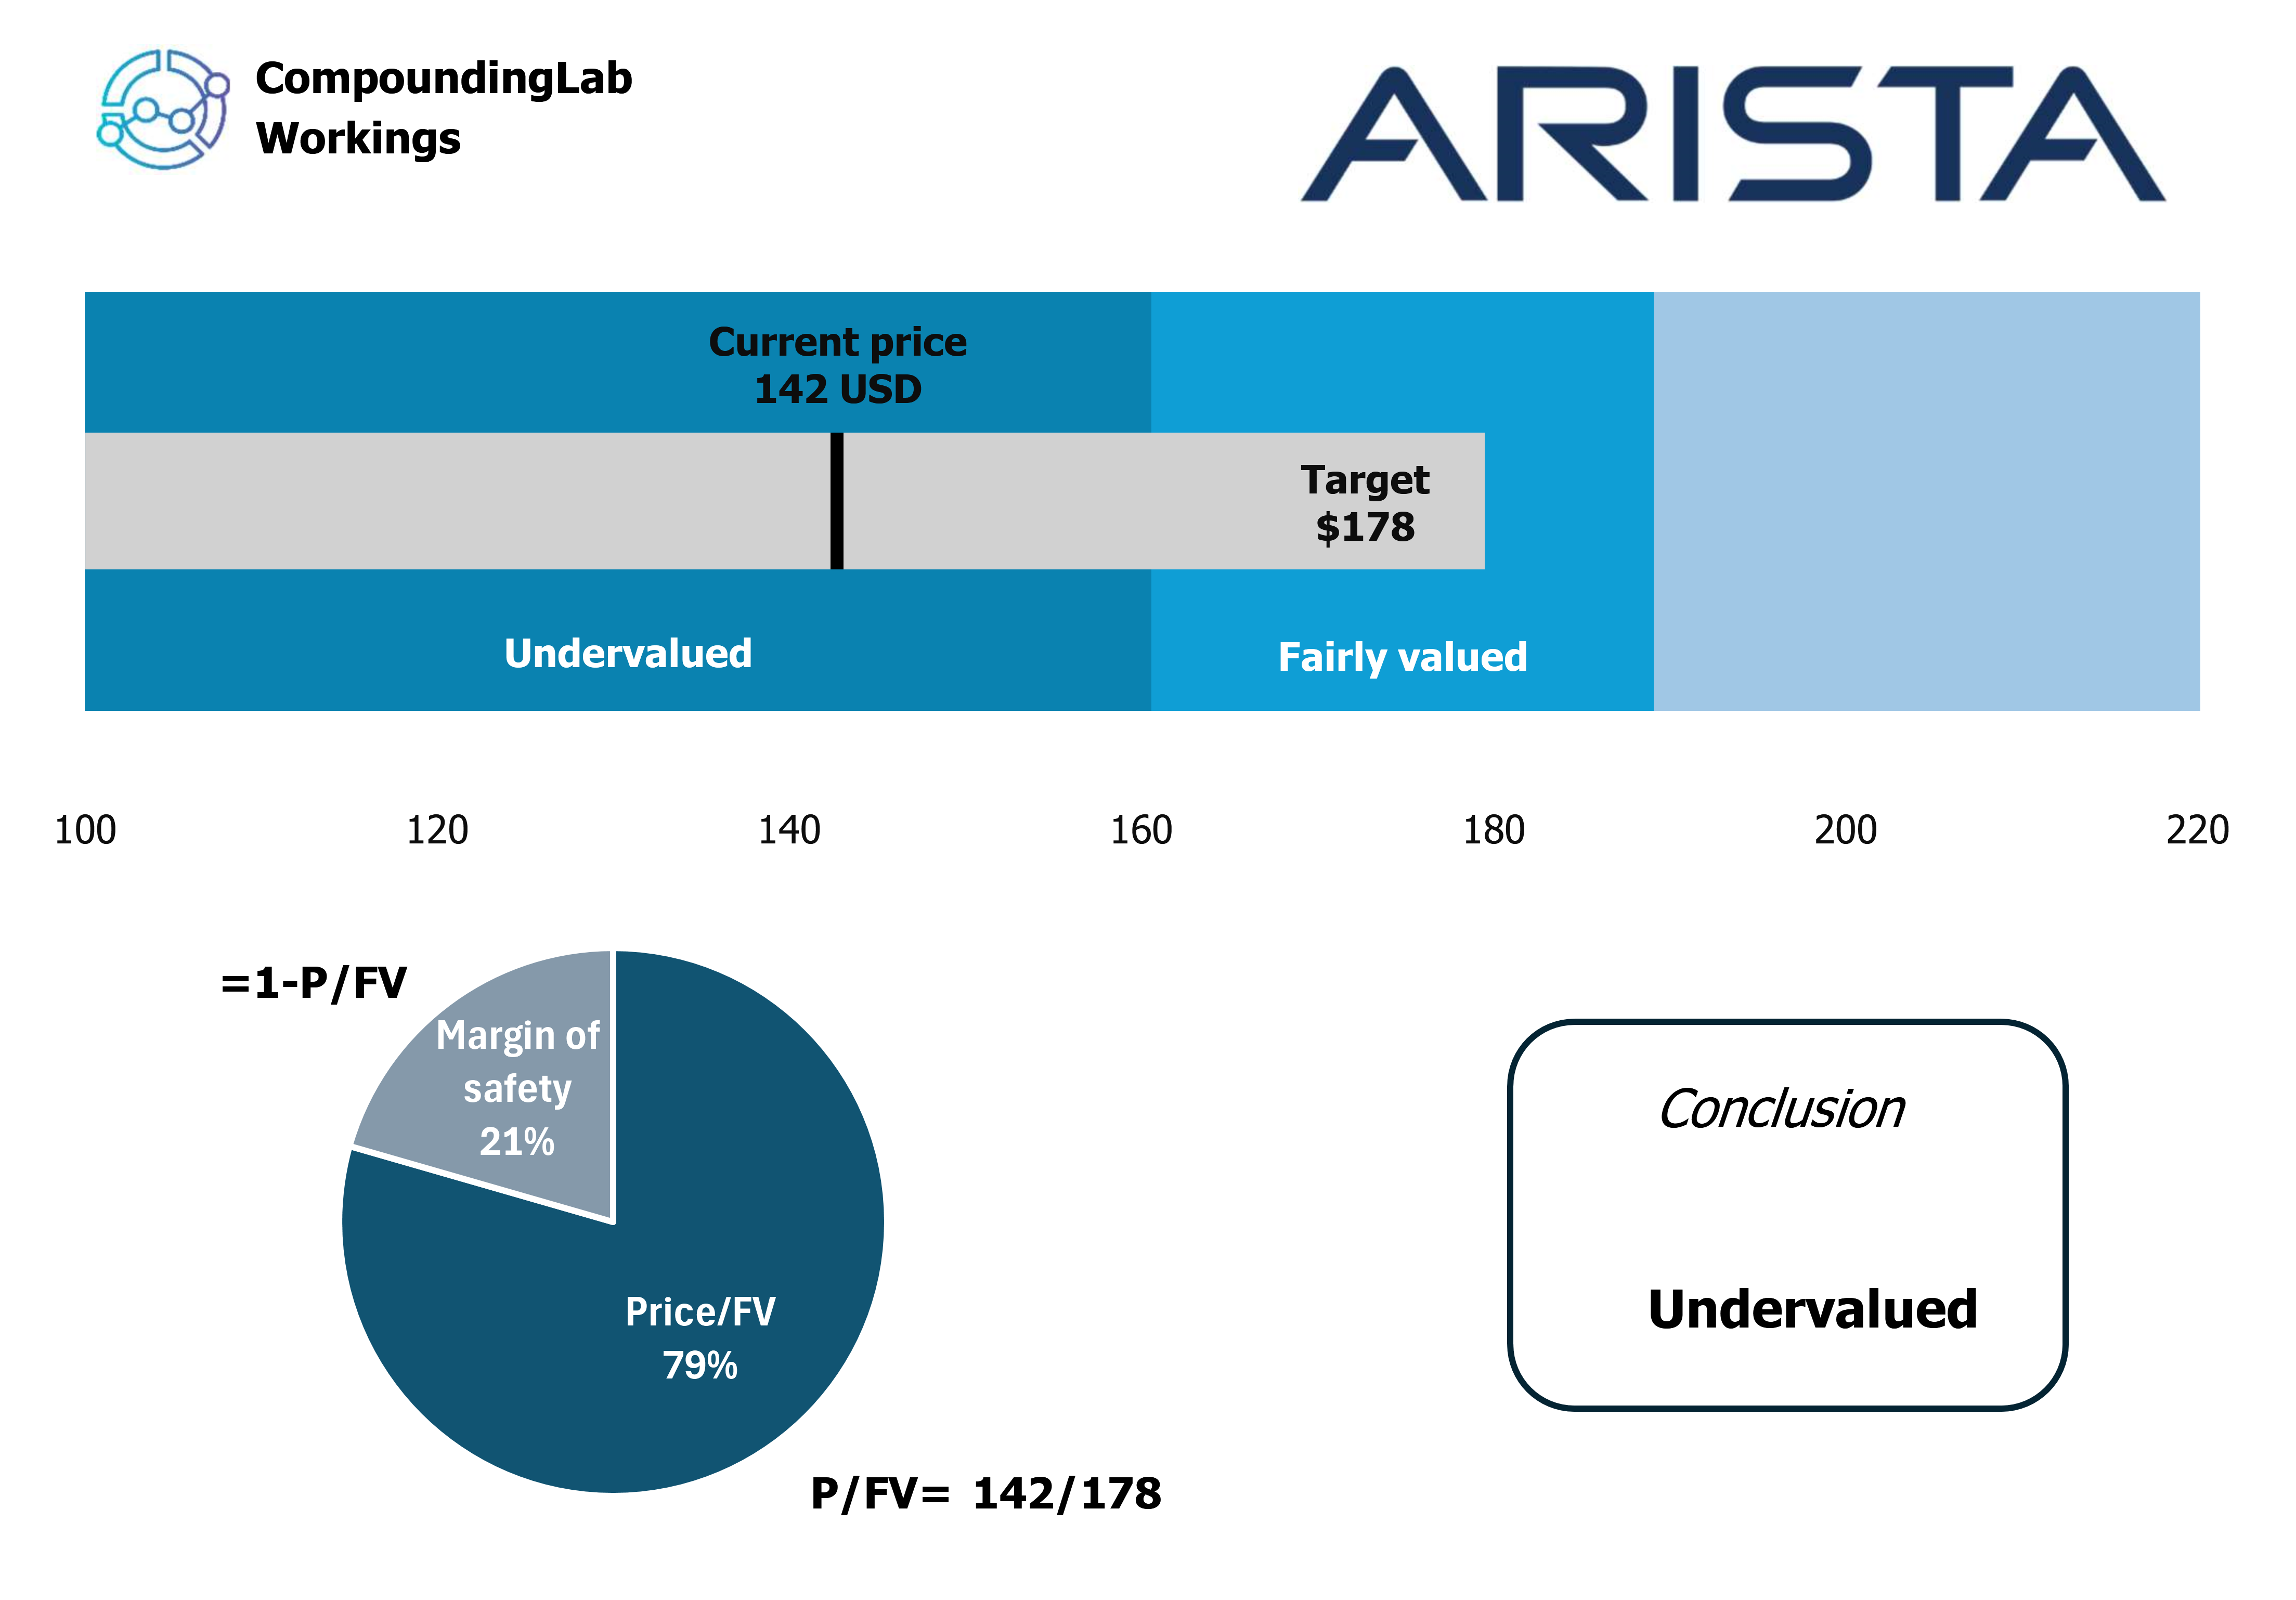
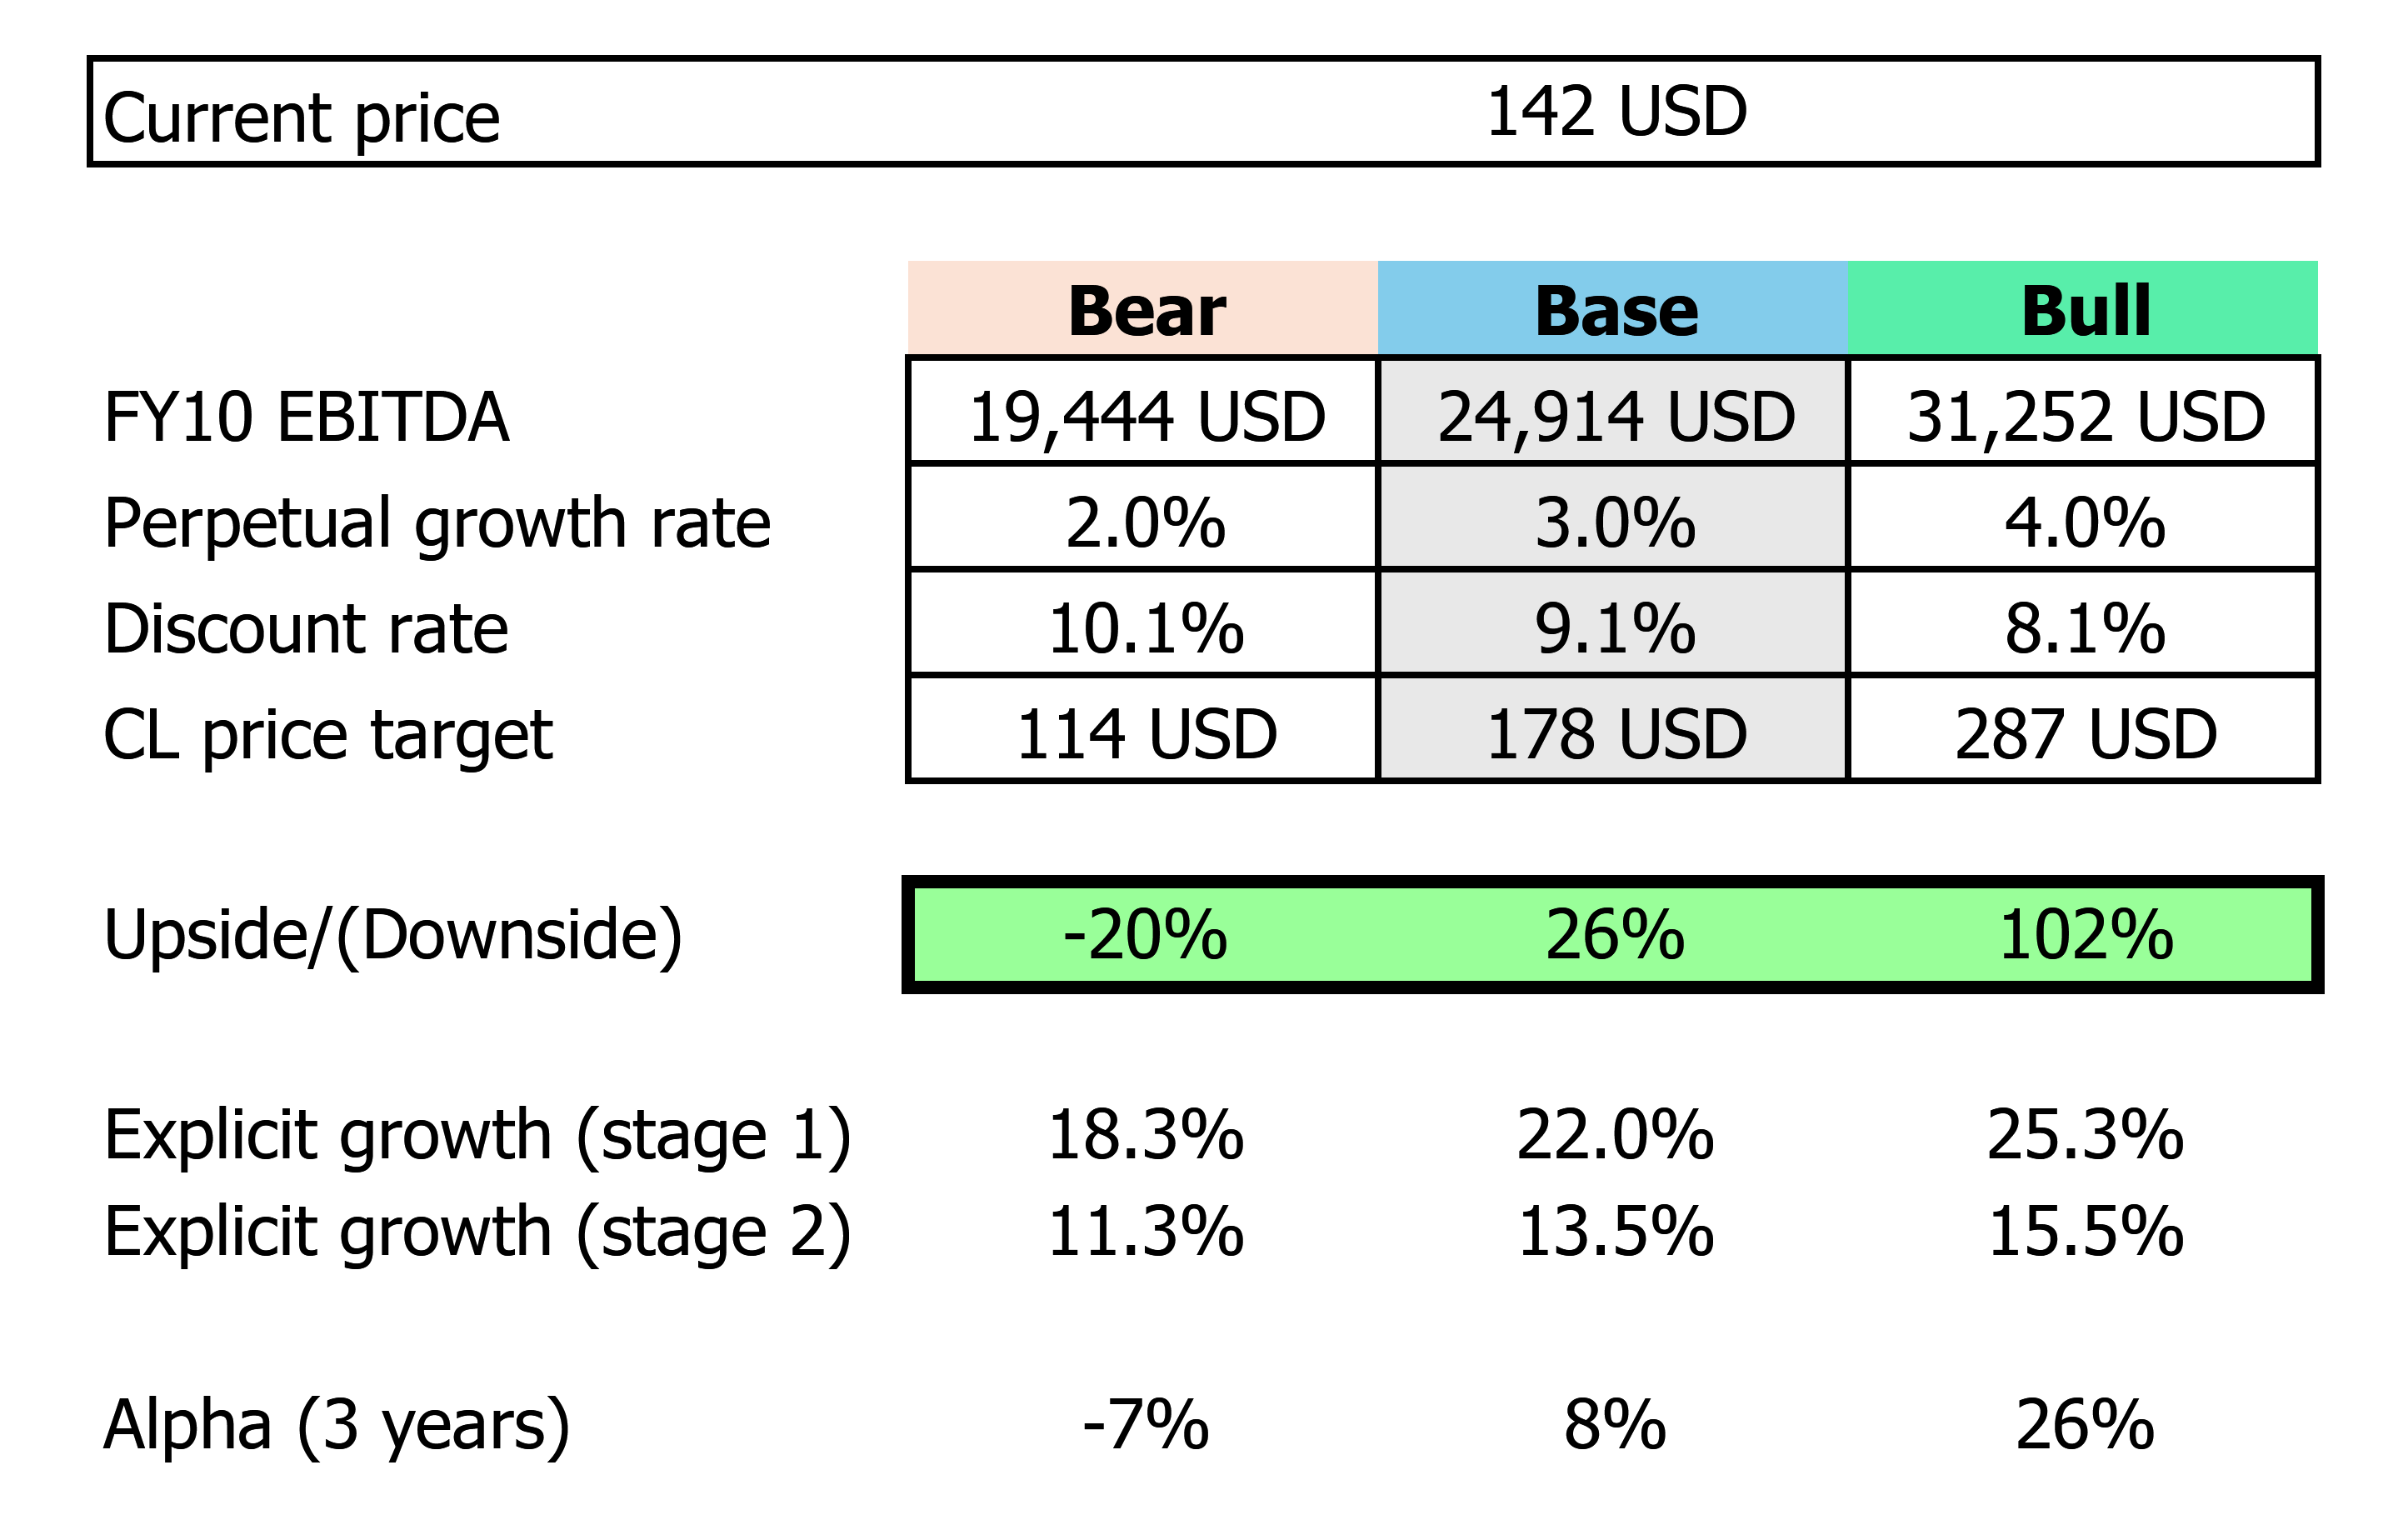
Base case
CL price target is $178. At current prices, Arista is trading at a 21% discount to fair value. If it closes that gap over 3 years, that’s 8% in annual alpha on top of the market. Here’s why we think it gets there.
AI is a networking problem, and Arista owns the pipes
ANET moat is the software, not the hardware
Hyperscaler relationships are a revenue flywheel
The financials are genuinely clean
Enterprise is the under-appreciated growth leg
Valuation has room to re-rate
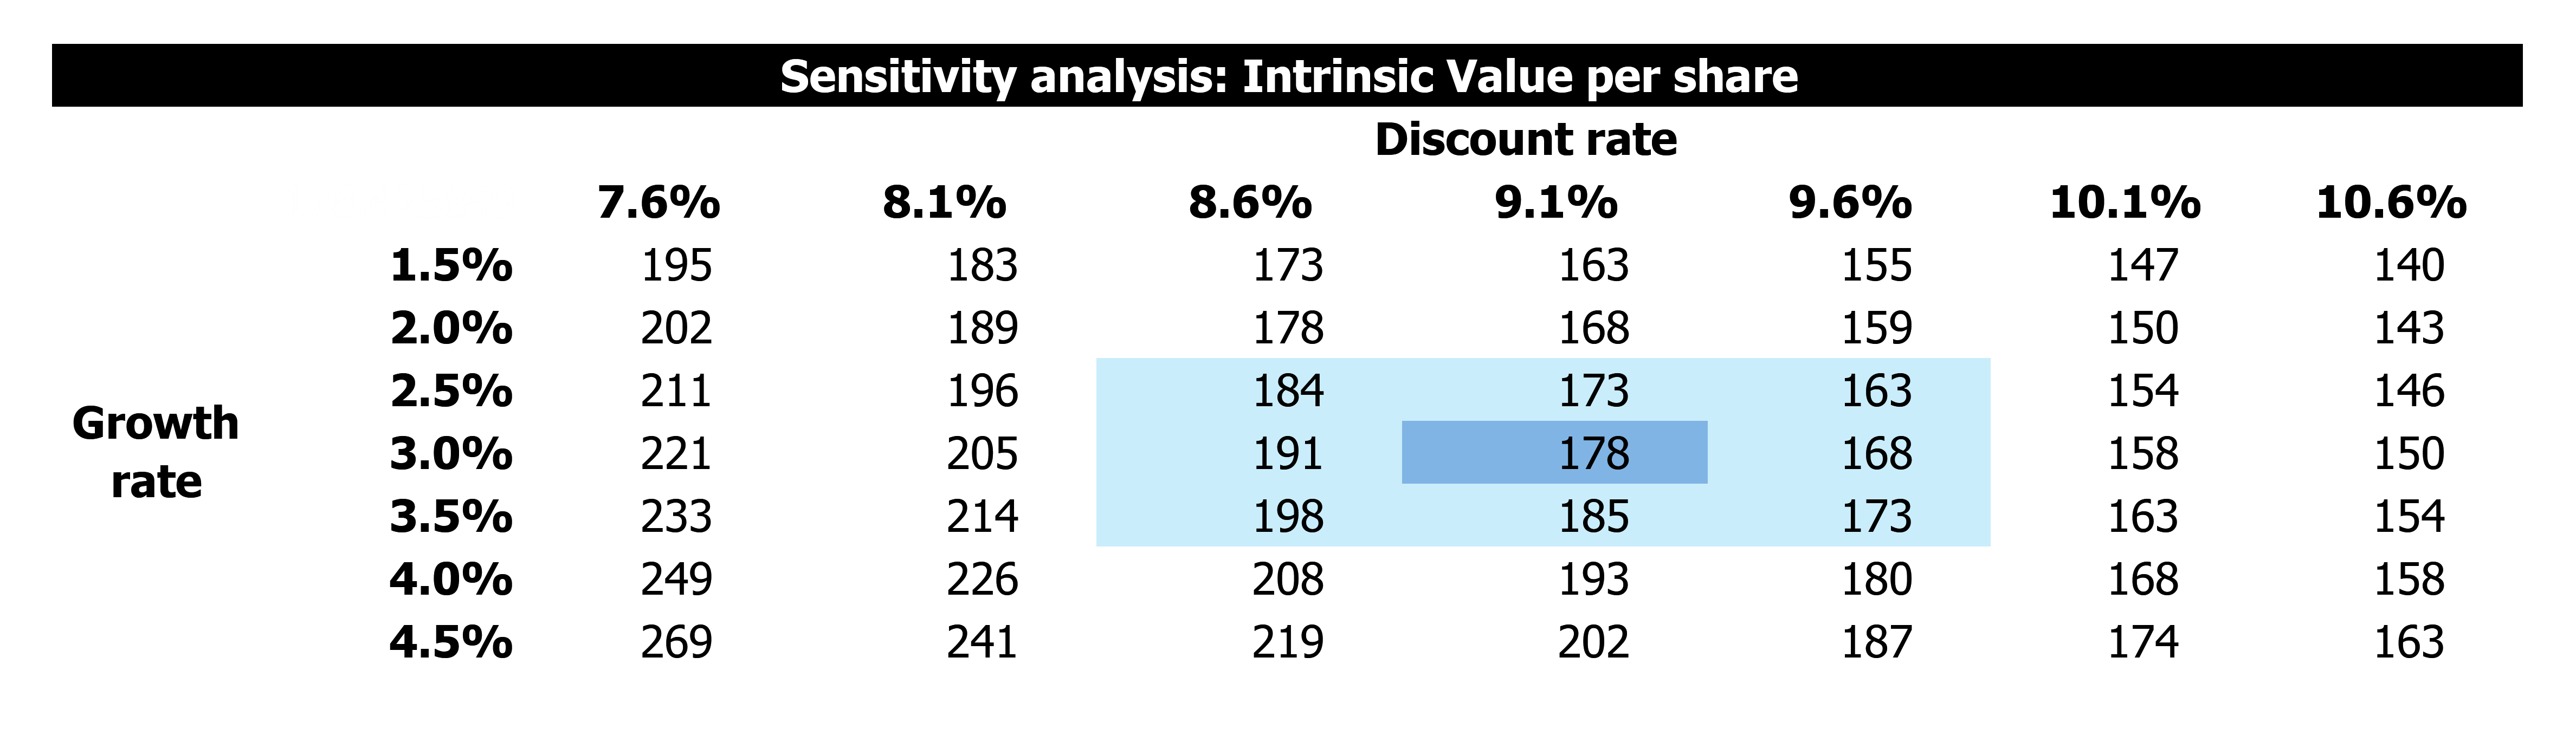
Sensitivity
If you disagree on certain aspects, you can choose your own assumptions based on the tables below.
Also, feel free to share this article by pressing the button below so that more people can see it.
Base case + Bear case + Bull case:
Sensitivity table:
Conclusion
Arista Networks is a rare convergence of structural tailwinds and superior execution: the dominant switching platform in data centre networking, the primary beneficiary of hyperscaler AI infrastructure buildout, and a company expanding into campus and enterprise markets from a position of technology and brand strength. At CL, we believe that entry is justified into this wide moat company trading at a discount to fair value.
Keep in mind that this is an estimate - just like any DCF model. Look at it as a thinking tool, not necessarily as a stock-picking tool.
___________________________________
Disclaimer: This post is for informational and educational purposes only. I do not own shares in ANET but can buy/sell them at any time after this post is published. Not financial advice. Do your own research.