Introduction into CL magic formula
The overview of Wide Moat portfolio created with my proprietary stock selection formula

Today, I want to talk about my magic formula of investing. I found it very recently, after trying to beat the market for more than a decade. With a random success, I have to admit.
I enjoy experimenting. My investing journey started in 2014 when I bought my first stock. I backtested countless strategies, and these tests showed that beating the index is very challenging over the long-term horizons. We all know this. It took me 12 years to find out CL magic formula of investing, which has demonstrated significant alpha generation potential.
In April 2025, I created a paper portfolio “Wide moat + GARP (growth at a reasonable price)” and shared with my X subscribers.
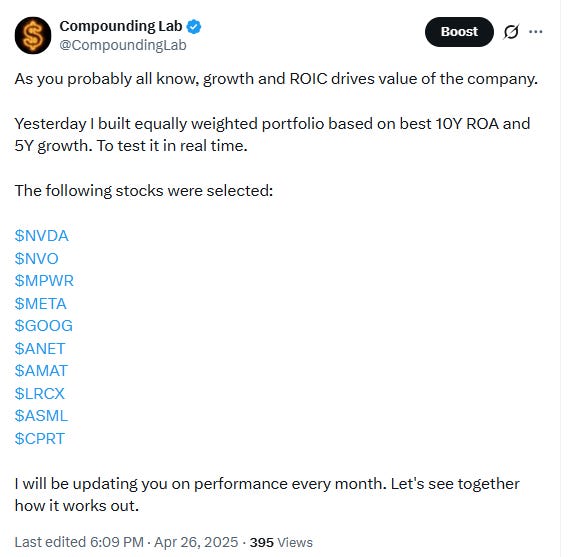
It was an equal allocation between 10 stocks and this portfolio performed greatly so far:
Lam Research +444%
Applied Materials +307%
ASML Holding +185%
Monolithic Power Systems +168%
Alphabet +124%
Arista Networks +117%
NVIDIA +89%
Meta Platforms +5%
Novo Nordisk -30%
Copart -50%
Cumulative portfolio return +135%
Today is the first time when I explain my formula in details.
Unfortunately for me, it was just a demo portfolio. Now that the formula has proved itself over a relatively long horizon (if we can call 1 year that), I can apply it to my own portfolio. At the moment I believe it’s already too late because the top stocks above are trading far above their intrinsic values. But I am preparing.
As we can see from historical performance, although not on a decade or long enough to make definitive conclusions, I do believe my magic formula will produce alpha going forward. Why so?
This is because my formula is based on key concept of “hidden” or assumed growth assets, which are never recorded on the balance sheet and therefore can be occasionally mispriced.
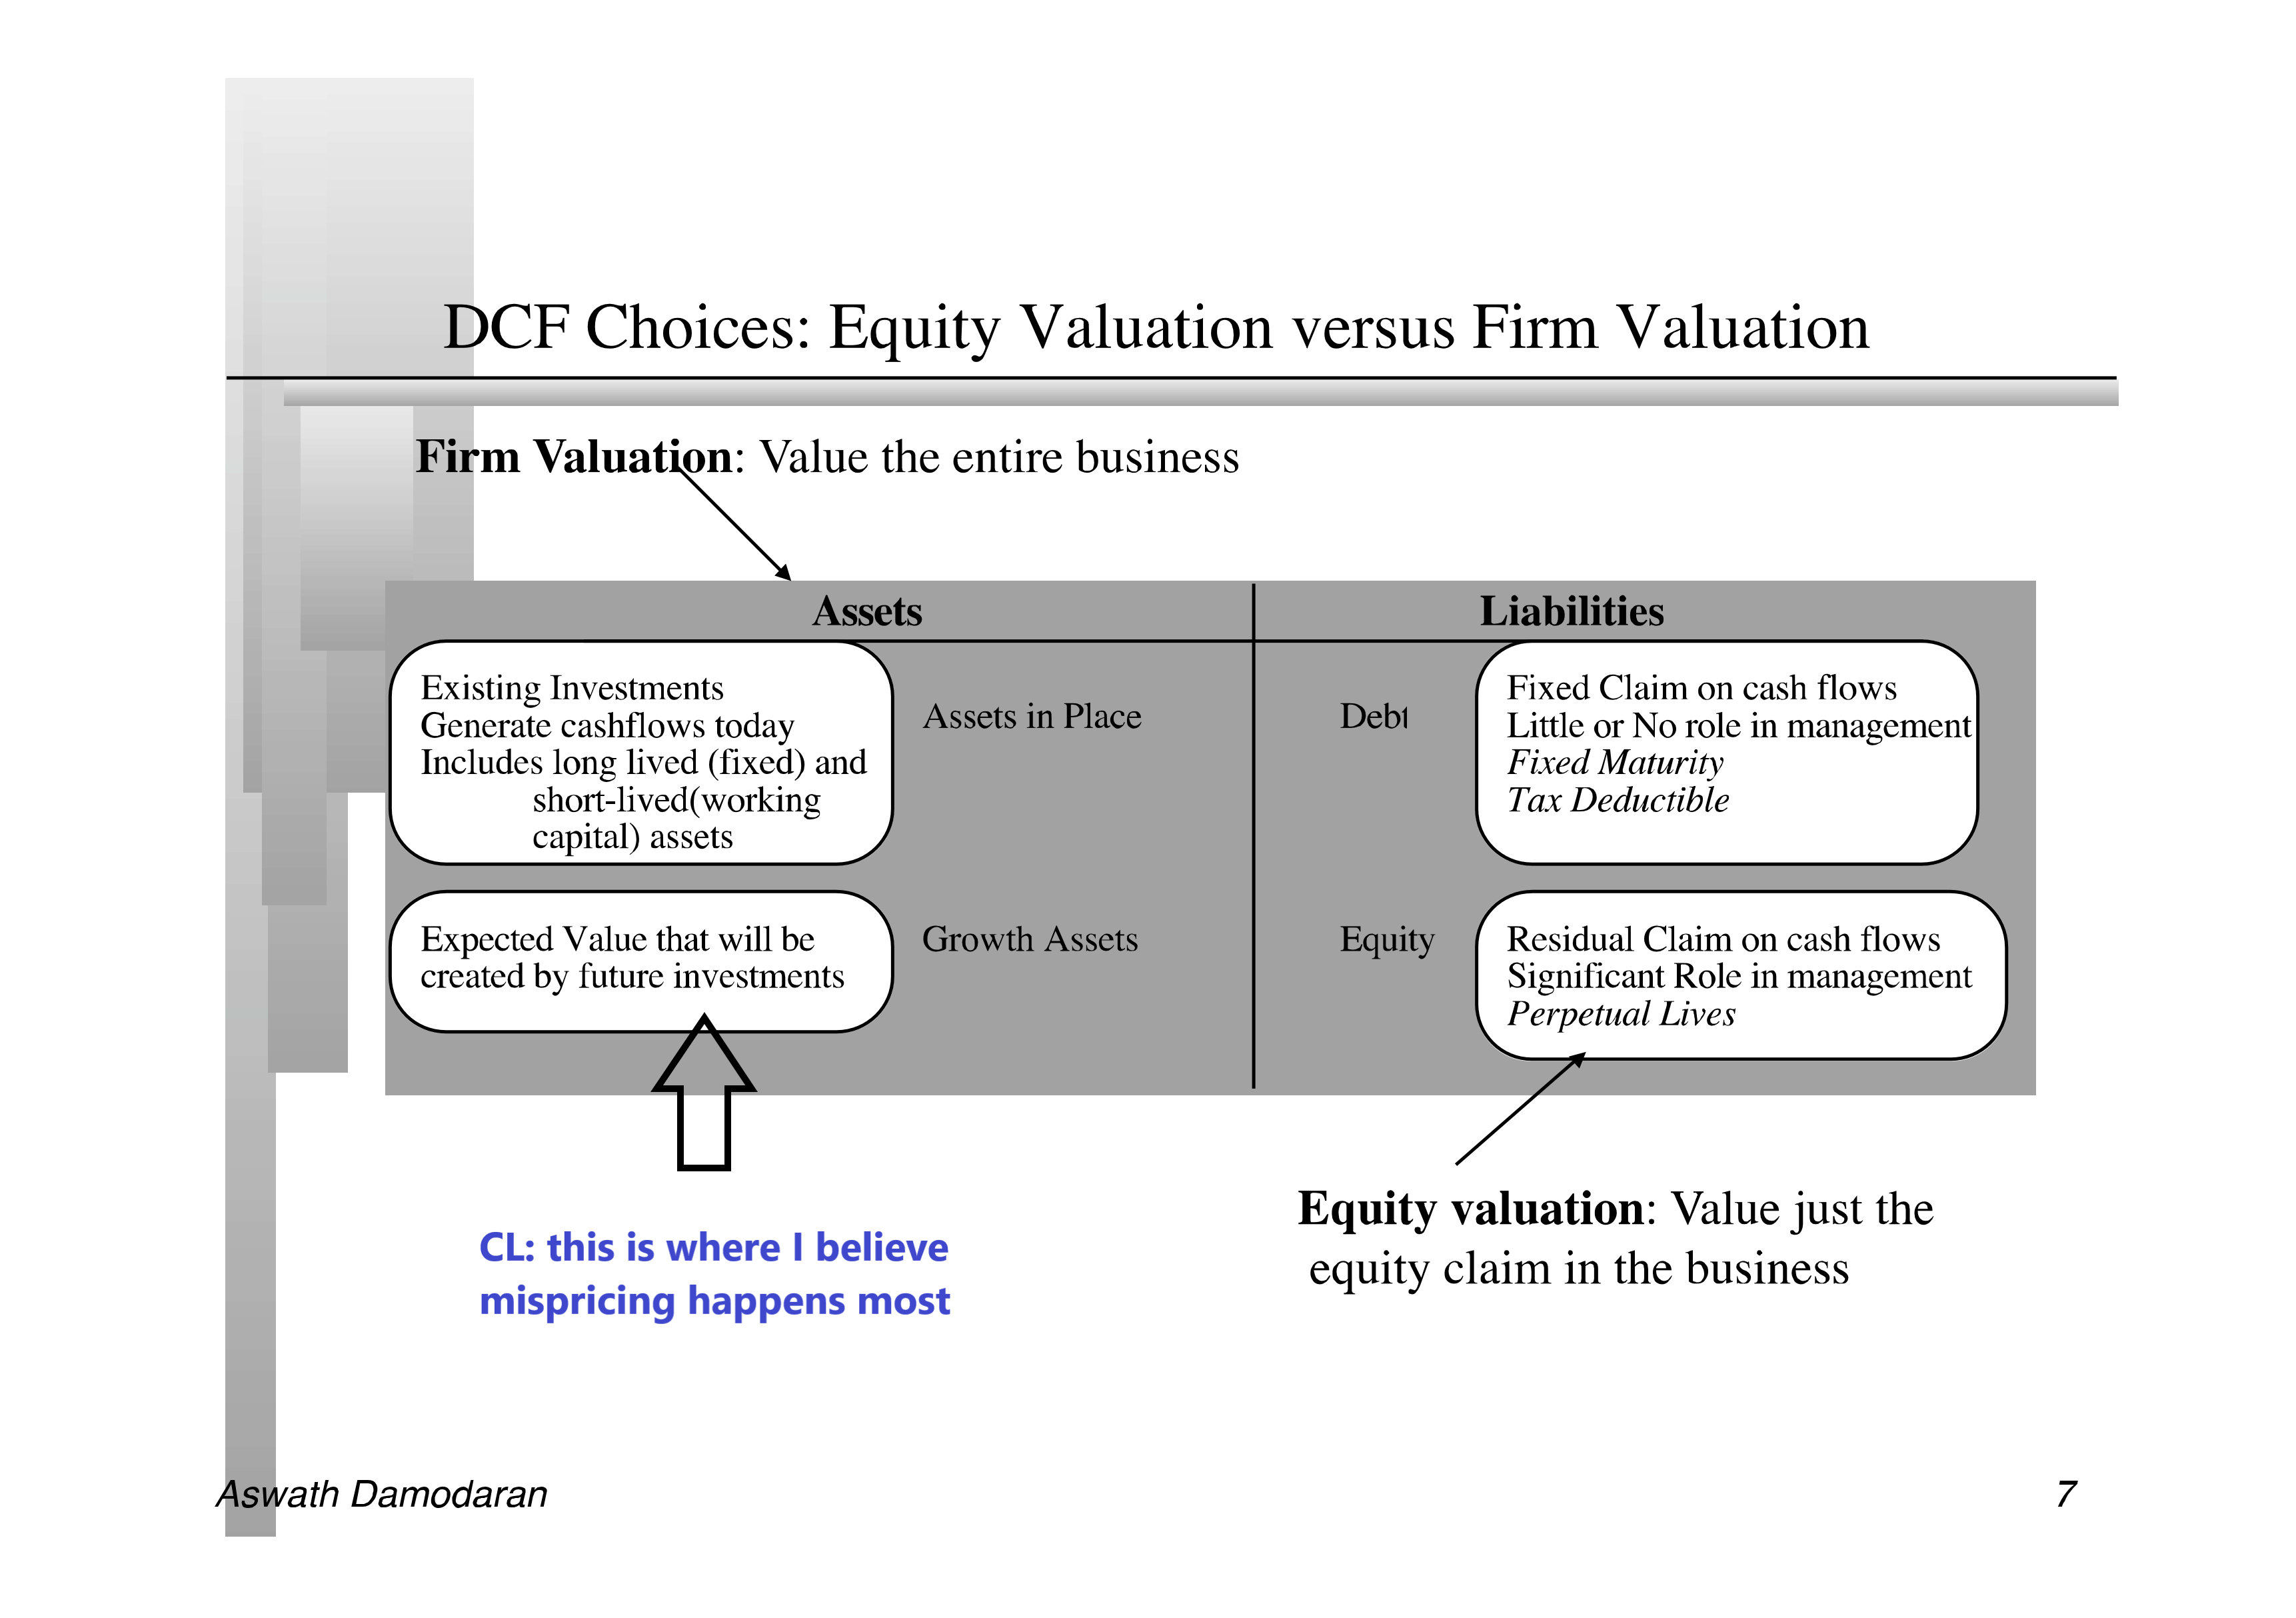
Although investors are generally good in pricing these “hidden” growth assets, undervaluation often happens, especially during bear markets. I believe it is a weakness within efficient market hypothesis and it is this weakness I am going to explore.
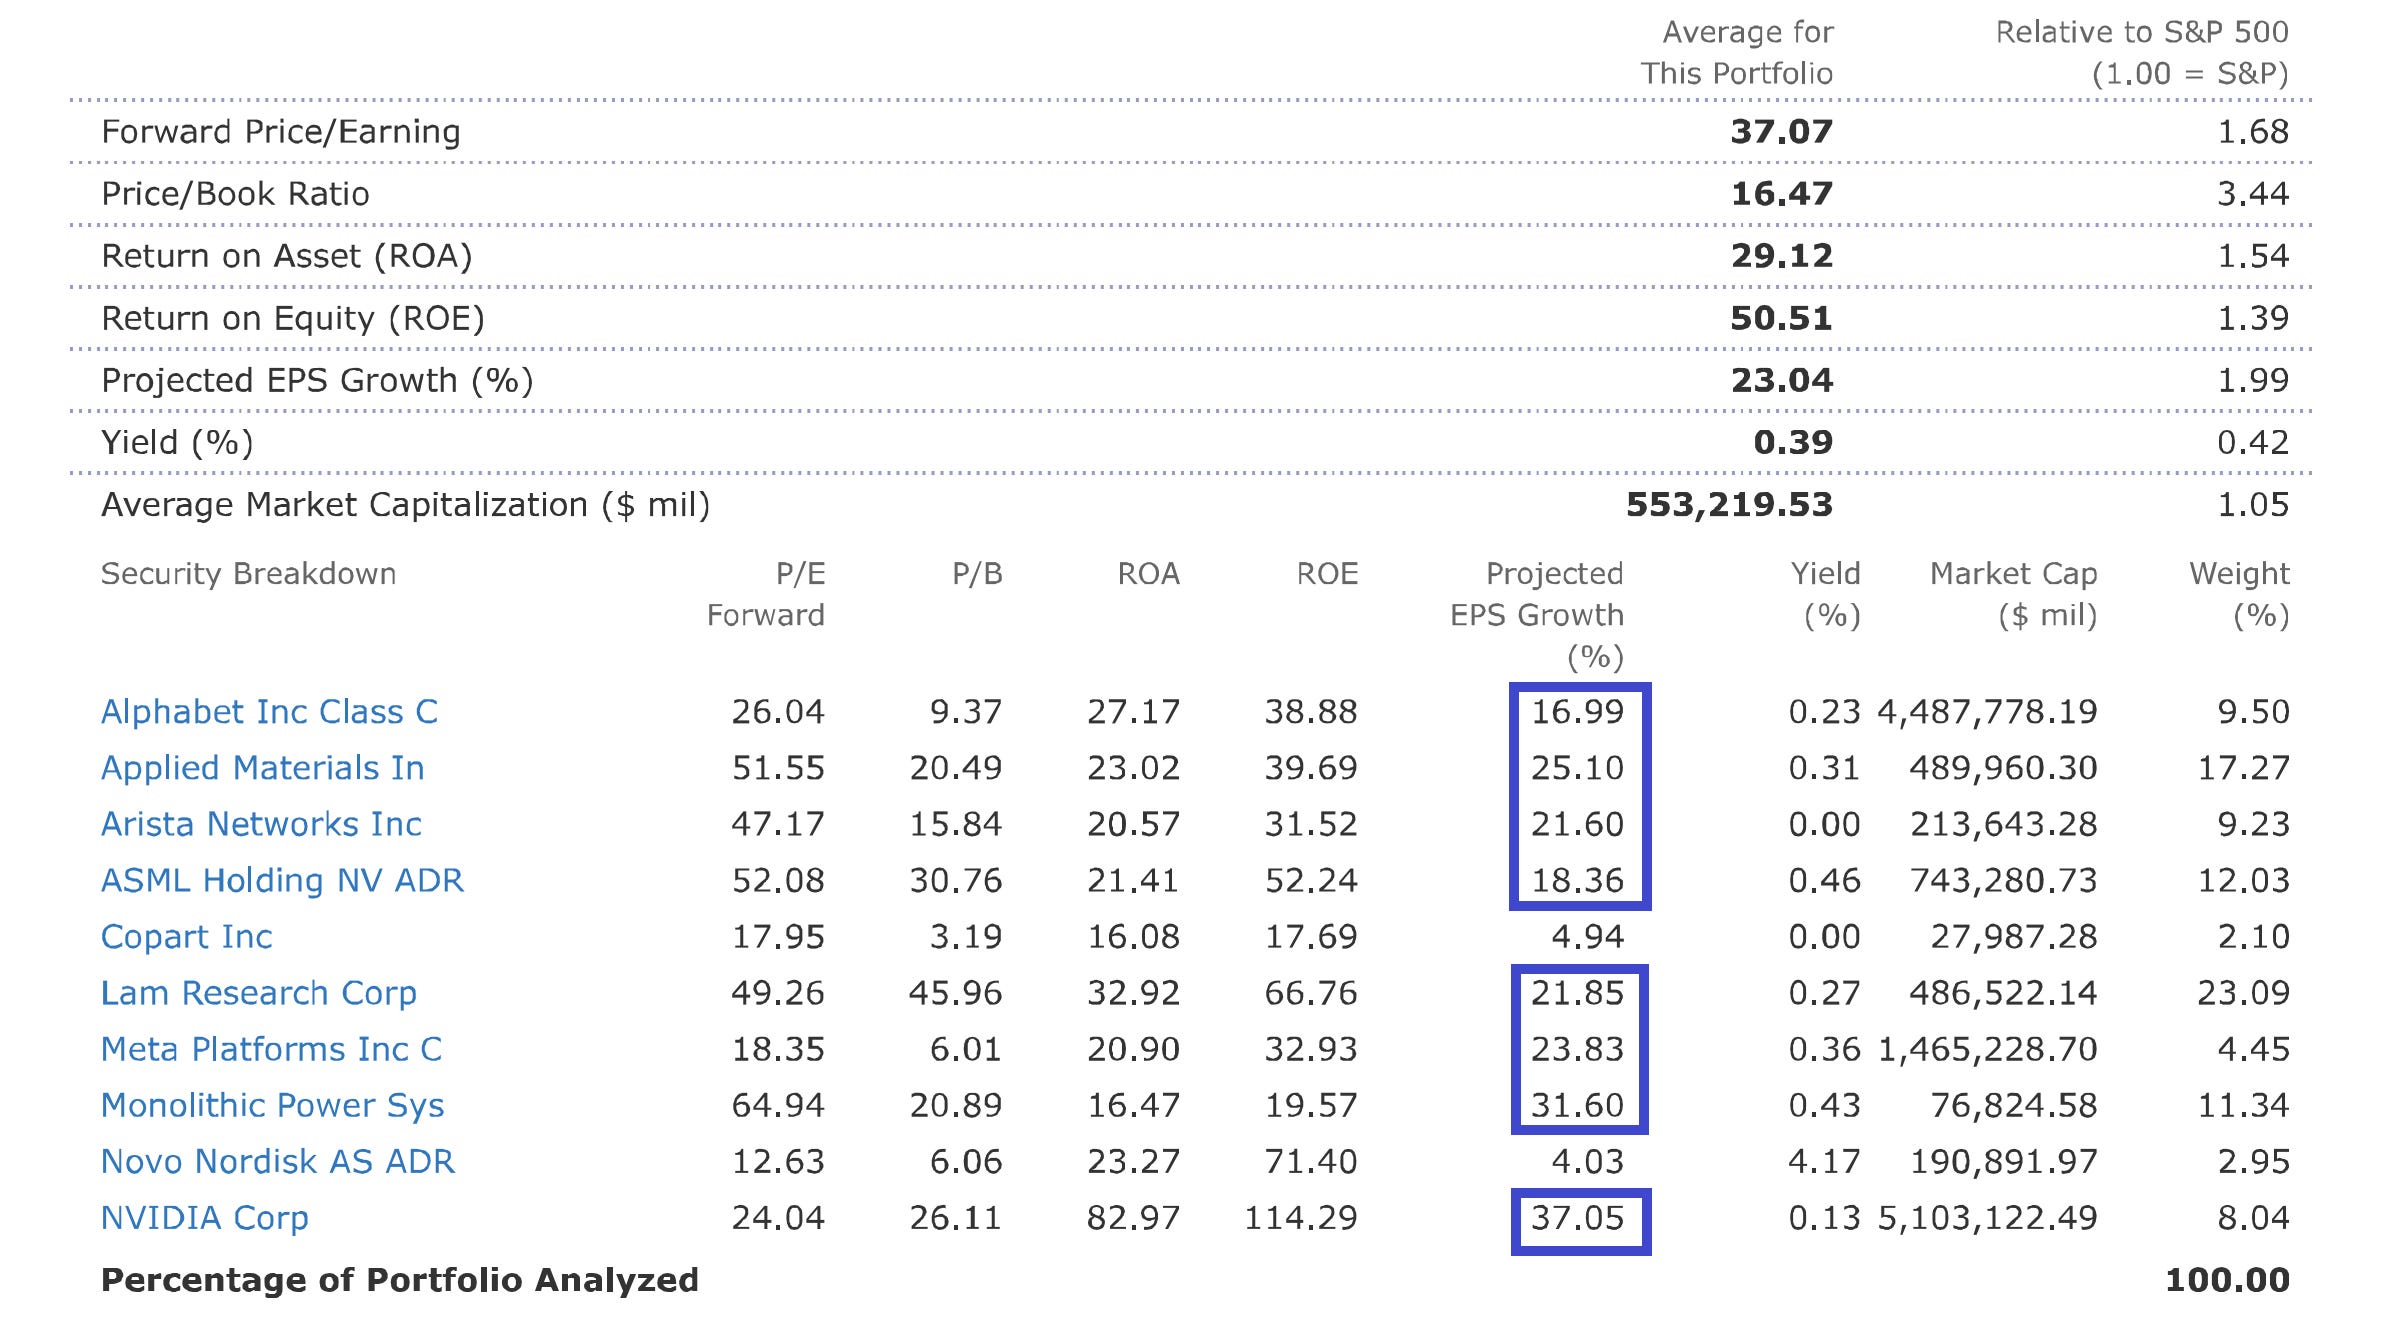
Stock stats speak for themselves. Average projected EPS growth currently stands at 23%, which is twice that of the expected growth for the S&P500. Since inception, stocks with the highest expected growth rates performed best. Copart and Novo, companies with the lowest expected growth, underperformed significantly. I see it as a confirmation of magic formula reasoning. There will, of course, always be laggards, like those 2. However, the formula is clearly working overall.
Despite all that being said, I do realize that the reason why referenced portfolio outperforms major indexes is because of the AI tailwind. Performance split is mainly explained by where each company seats in the AI investment cycle. Investors moved from assuming that AI demand may fade over time to realizing that this is a multi-year infrastructure buildout, causing valuation expansion. This is expectations investing in action. Here is a quick summary of why winners ran:
Lam Research +444%
Lam was one of the biggest beneficiaries of the market realising that AI requires far more than GPUs: advanced logic, HBM memory, 3D NAND, advanced packaging and more complex wafer-processing steps. Revenue rose from roughly $4.7bn in the March 2025 quarter to $5.84bn in March 2026, while operating margin reached 35%. Another key driver of a +444% return was a major re-rating as investors began treating the equipment cycle as longer and structurally AI-driven rather than a normal semiconductor upcycle. Current market price: 389; PT by 31 analysts: 320 (overvalued by 22%).
Applied Materials +307%
Applied had a similar setup, but with broad exposure to deposition, materials engineering, foundry/logic, DRAM and advanced packaging. It reported record quarterly revenue of $7.91bn, up 11% year over year, with GAAP EPS up 33%. Management also expects semiconductor-equipment growth of more than 30% in calendar 2026 and packaging revenue growth above 50%. That changed the earnings-power narrative very quickly. Current market price: 617; PT by 32 analysts: 525 (overvalued by 18%).
ASML +185%
ASML is the clearest “scarcity asset” in the group. It is the bottleneck for leading-edge lithography, particularly EUV. The company delivered €8.8bn in Q1 2026 sales at a 53% gross margin and raised 2026 sales guidance to €36–40bn. The stock benefited as AI demand broadened from Nvidia alone into leading-edge logic and memory investment across the industry. Current market price: 1,657; PT by 35 analysts: 1,568 (overvalued by 8%).
Monolithic Power Systems +168%
MPS captured a less obvious but critical AI bottleneck: power management. Higher GPU density means much more complex power delivery inside servers, racks and networking gear. Its Enterprise Data revenue reached $262.8m in Q1 2026, up 97.7% year over year, while total company revenue grew 26%. Investors rewarded the shift from a diversified analog-chip company to a direct AI data-centre beneficiary. Current market price: 1,563; PT by 14 analysts: 1,812 (undervalued by 14%).
Arista Networks +117%
AI clusters need high-speed networking, not only chips. Arista sells much of that networking infrastructure to cloud customers. Q1 2026 revenue grew 35.1% year over year to $2.71bn. The stock rerated because the market increasingly viewed networking as a structural part of AI capex rather than a normal enterprise-switching cycle. Current market price: 170; PT by 26 analysts: 190 (undervalued by 10%).
Alphabet +124%
Alphabet started from a position of scepticism: investors worried AI would weaken Search economics. Instead, the market saw evidence that AI was supporting the core ad business while creating a second growth engine in Cloud. Google Cloud exceeded $20bn in quarterly revenue, grew 63%, and backlog rose above $460bn. In effect, Alphabet moved from “AI disruption risk” to “AI monetisation opportunity.” Current market price: 368; PT by 53 analysts: 430 (undervalued by 14%).
Nvidia +89%
Nvidia’s business execution was arguably the strongest of all: Q1 FY2027 revenue rose 85% year over year and Data Center revenue rose 92%. But the stock had already entered April 2025 with extreme expectations and massive capitalization. So it still performed very well, but less spectacularly than suppliers such as Lam, Applied and MPS, where the market had more room to upgrade estimates and terminal-value assumptions. Current market price: 210; PT by 57 analysts: 288 (undervalued by 27%).
Why the laggards underperformed:
Meta +5%
Meta is not really an operating laggard. Q1 2026 revenue grew 33%, ad impressions rose 19%, average ad prices rose 12%, and operating margin held at 41%. The problem is that investors became less certain about how much free cash flow will remain after AI spending. Meta lifted its 2026 capex range to $125–145bn. The market currently treats Meta as an AI spender with an unclear monetisation timeline, while it treats Alphabet as an AI spender with an immediately monetisable Cloud business. Current market price: 577; PT by 59 analysts: 825 (undervalued by 30%).
Novo Nordisk -30%
Novo suffered a genuine expectations reset. The original obesity-drug story assumed high growth, strong pricing and long duration. Instead, the market had to absorb Eli Lilly competition, price pressure, policy risk, copycat products and patent-expiry concerns in some markets. Novo’s 2026 guidance calls for adjusted sales and operating-profit growth of negative 5% to negative 13% at constant exchange rates. That is a dramatic change from the previous “GLP-1 growth machine” narrative. Current market price: 43; PT by 22 analysts: 45 (fairly valued).
Copart -50%
Copart looks more like a valuation and growth-rate reset than a broken moat. Its business depends on insurance volumes, total-loss trends, used-car values and auction activity. Fiscal Q2 2026 revenue fell 3.6% and net income fell 9.5%; Q3 stabilized, but revenue grew only 2.1%, while nine-month revenue was essentially flat. A premium compounder priced for steady double-digit growth can fall sharply when earnings flatten, even if the long-term business quality remains intact. Current market price: 30; PT by 9 analysts: 42 (undervalued by 28%).
Joel Greenblatt was 47 years old when he introduced the Magic Formula publicly in The Little Book That Beats the Market in 2005, describing it as a method for determining which stocks to buy: “cheap and good companies” with a high earnings yield and a high return on invested capital. My formula resembles this approach in many steps, but there are major caveats that I will explain below.
According to Greenblatt, he used the following criteria:
Screen a broad universe of non-financial and non-utility companies. This is in line with CL approach.
Rank every company separately by earnings yield and return on capital. In my formula, I am using ROA instead of ROIC. I am also utilizing P/E ratio, which is a reverse ratio of earnings yield. An important difference is the introduction of growth rates into the formula. According to M. Mauboussin and McKinsey valuation framework, growth and ROIC drive value creation. I apply these same principles when developing my formula. I will only consider Wide Moat companies in portfolio formation.
Add the two rank positions together. In line with CL approach, although I have 3 indicators.
Buy roughly 20–30 stocks with the best combined ranks. In my formula, number of stocks is limited to 10.
Hold each position for about one year, usually replacing positions gradually during the year. Here where my approach differ significantly.
Repeat consistently for several years. Instead of years, I am going to rebalance only when significant drawdown occur. I prefer not to touch a portfolio and allow winners run for a longer. On average, a 20% drawdown (or bear market) in the S&P 500 occurs roughly every 4 to 5 years. If history can give us any clue about the future, that is the average holding period I intend to hold.
On my Substack, I will publish allocation and regular updates for free. This is not a blackbox, paid-monthly “follow my signals” subscription or underperforming “paid subscribers get all my buys/sells”. Stock selection is done once and kept unchanged until the next significant drawdown, which is normally at least 20%. Once there is a bear market, it will be rebalanced and a new allocation shared for free.
I will keep posting DCF models, but I have to admit that recent experience shows that a carefully chosen portfolio using the magic formula outperforms one selected through the DCF approach. If you are interested in seeing how this story evolves, hit that like and share button – let’s grow together!
Thanks for reading.