$INTU DCF valuation model

If you own a stock and haven’t run the intrinsic value math, you’re holding a position on faith, not conviction. Today we explore what the numbers actually say for $INTU.
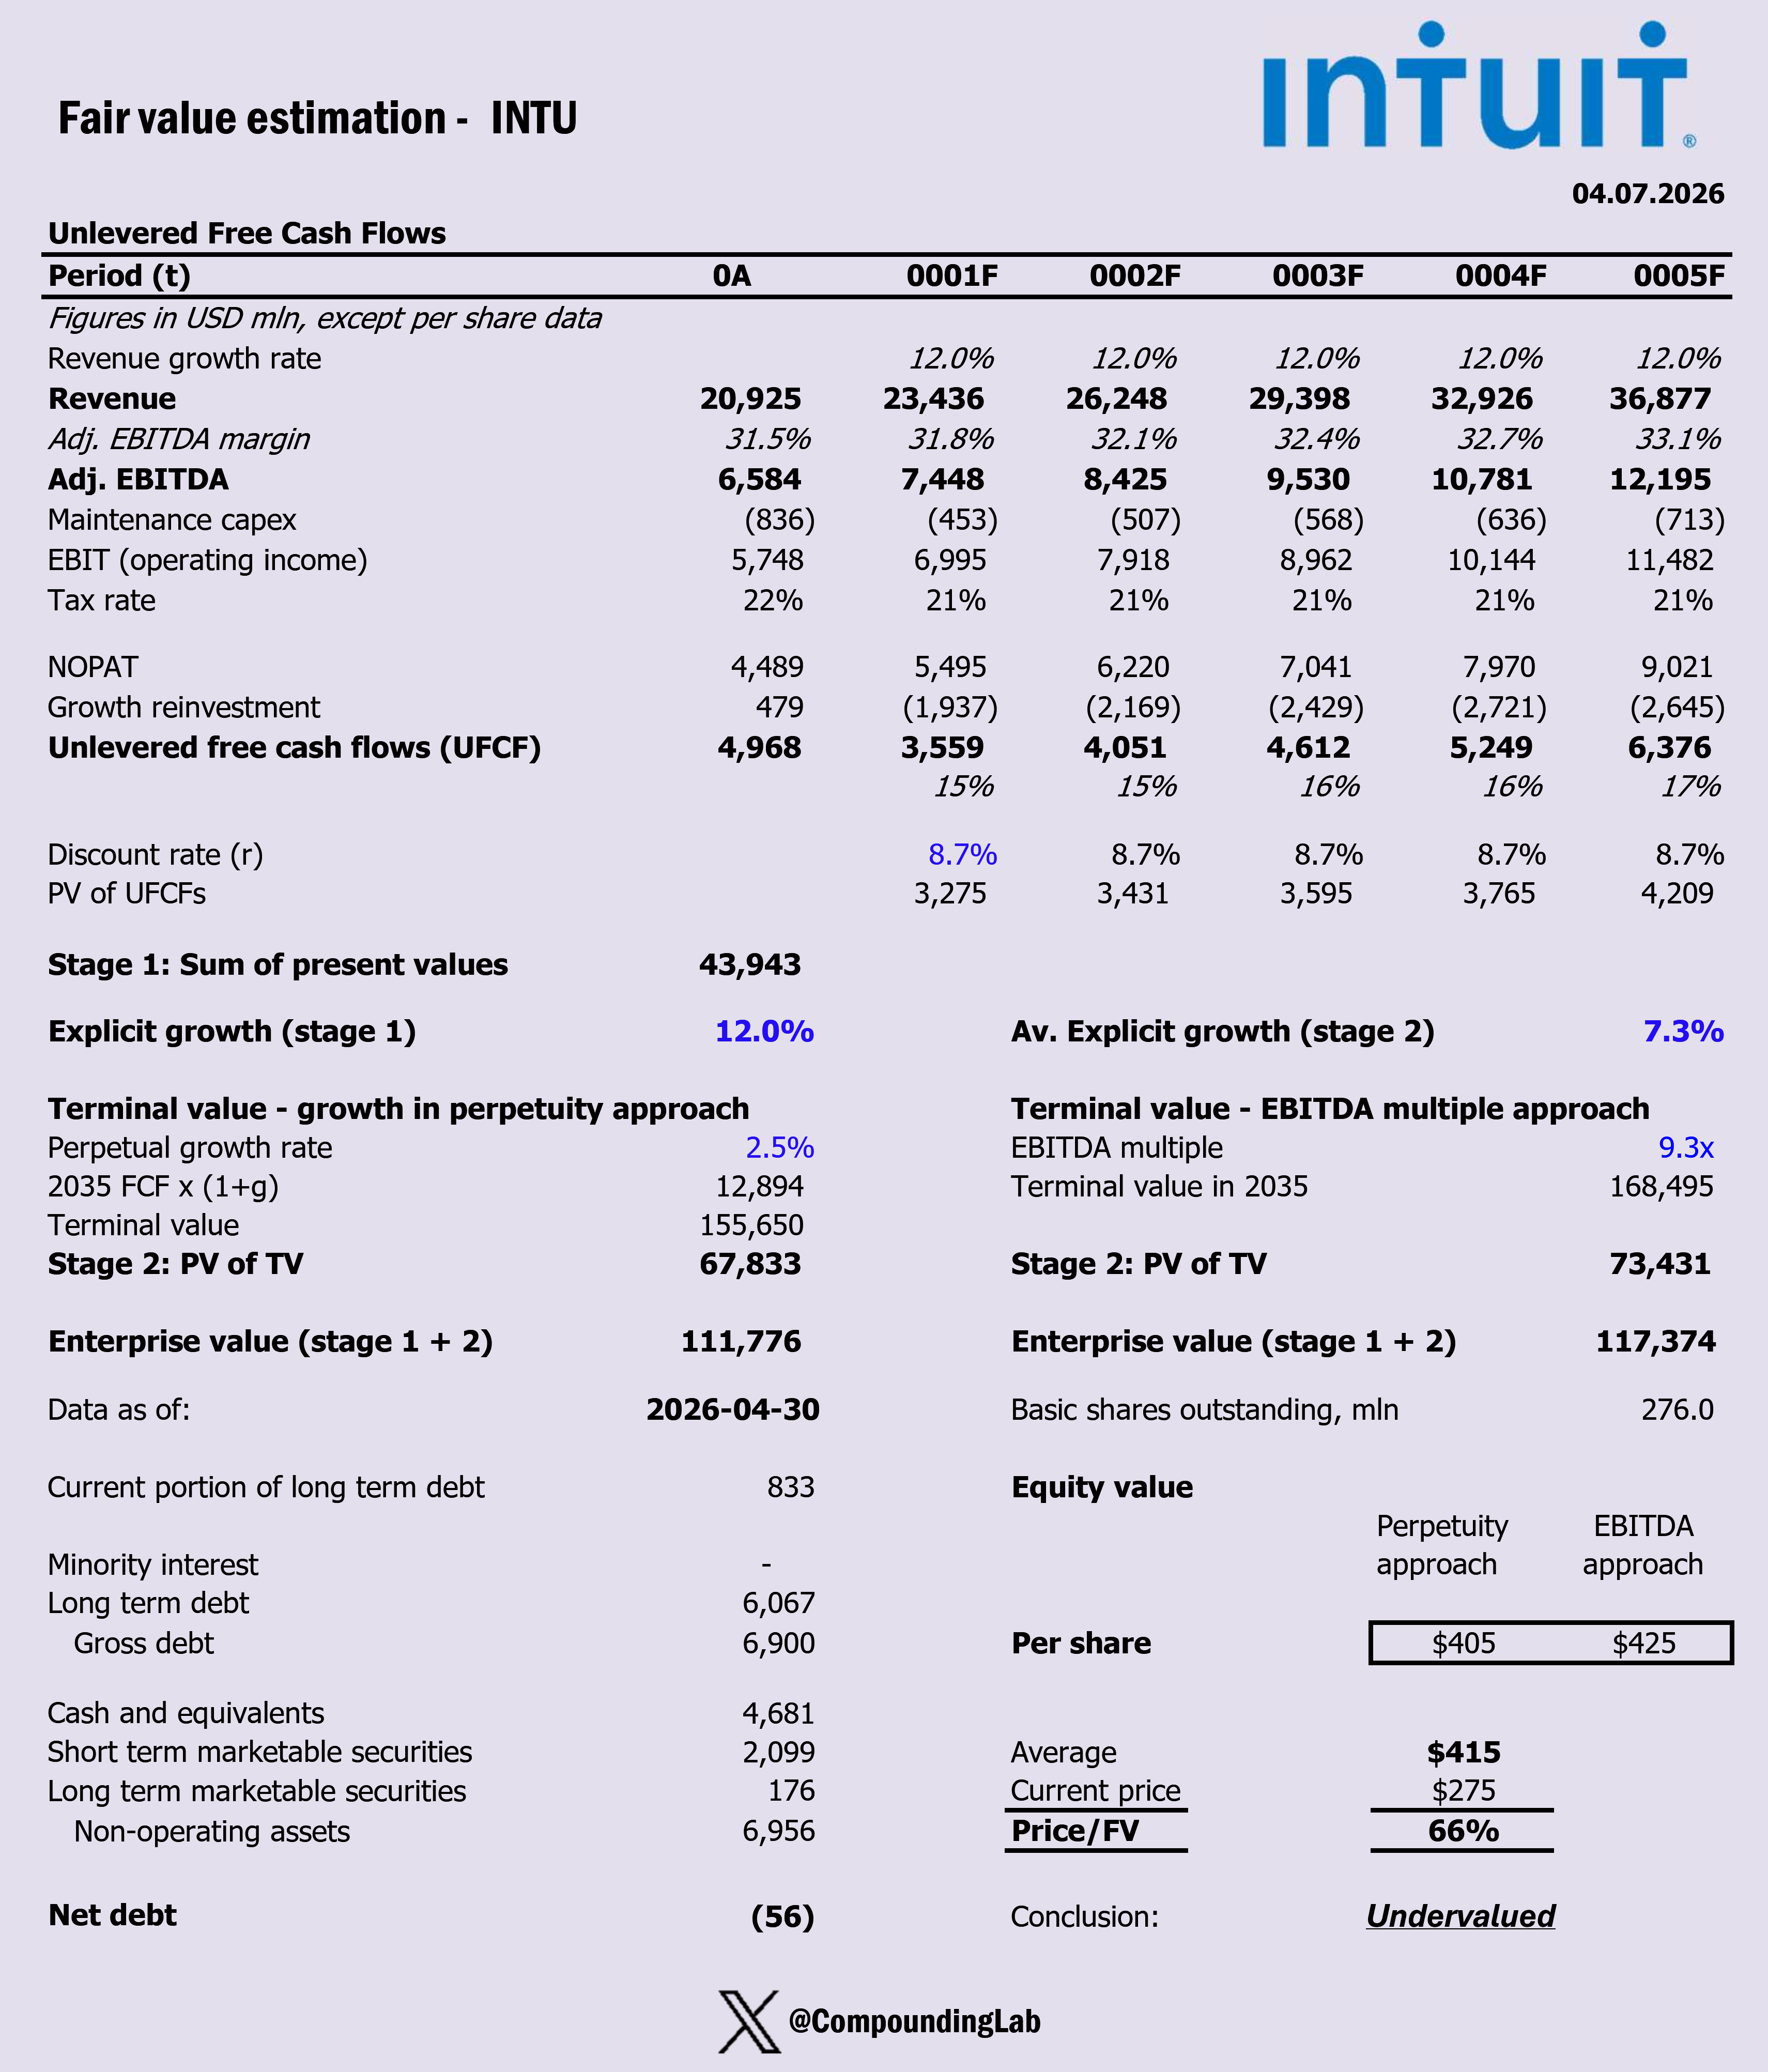
Key assumptions:
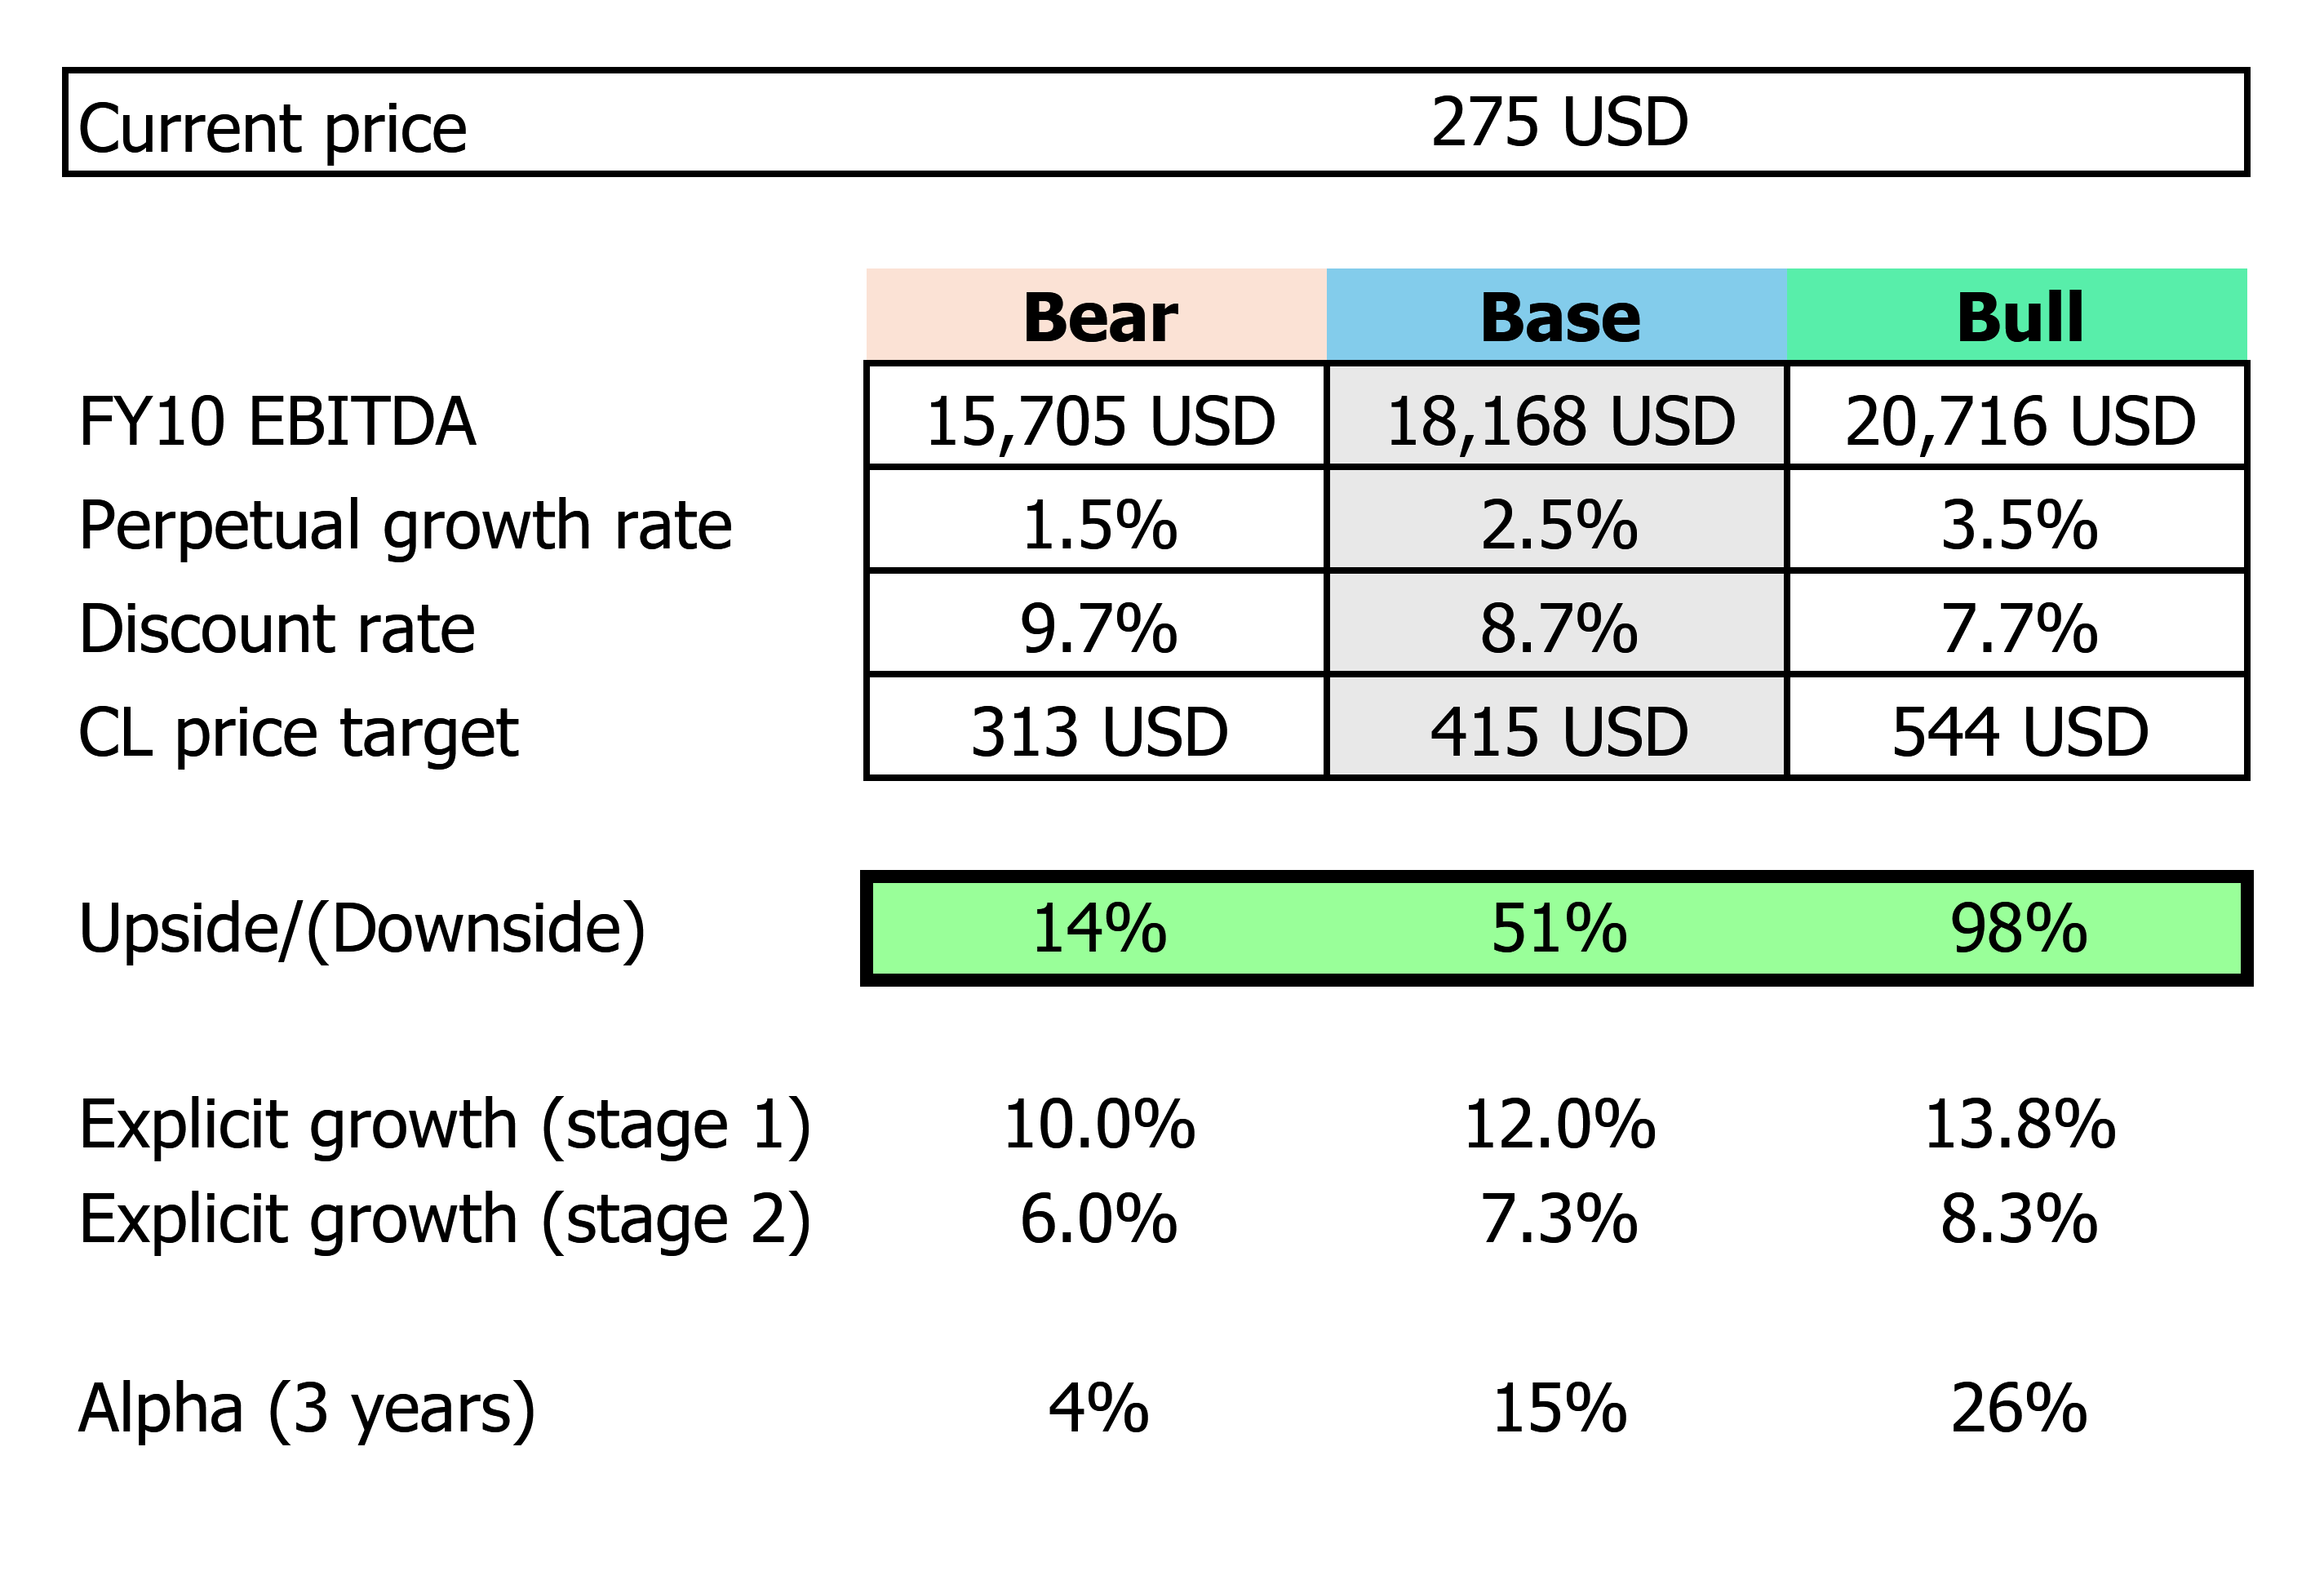
Explicit average 5Y/5Y growth @ 12%/7.3%
Long-term growth in perpetuity @ 2.5%
EBITDA Margin @32% improving gradually to 35% in Y10
WACC @ 8.7%
Tax rate 21%
The input that drives reinvestment is the Sales to Capital ratio = 1.45
Adj. EBITDA exit multiple of 9.3
Business description
Intuit began in 1983 when Scott Cook and Tom Proulx created Quicken, PC software designed to simplify household budgeting and checkbook management; it then expanded into small-business accounting with QuickBooks in the 1990s and consumer tax preparation through TurboTax, building powerful category-leading positions in both markets. Over the following decades, Intuit shifted from selling desktop software to cloud subscriptions and an integrated small-business ecosystem that includes accounting, payments, payroll, lending connections and marketing tools. Major acquisitions accelerated that evolution: Credit Karma added consumer credit and personal-finance data in 2020, while Mailchimp brought email marketing and customer-engagement capabilities in 2021. Today, led by CEO Sasan Goodarzi, Intuit is positioning itself as an AI-driven financial platform spanning QuickBooks, TurboTax, Credit Karma and Mailchimp, with an increasing focus on automating work for consumers, small businesses, accountants and larger mid-market customers.
We recall Adobe’s recent volatility. The environment regarding the impact of AI is similar for INTU – the company is asserting it as an advantage, but analysts remain skeptical. Further discussion on this matter will follow.
Forward growth rate
The ten-year compound annual growth rate of Intuit’s revenue is 16%. Its flagship application, QuickBooks accounting software, has experienced double-digit growth in the past, but slightly lower recently. Intuit has not disclosed the QBO-only number of users since 2024, but its online Ecosystem customer count grew at a much lower rate of 5-6% in 2024-25. Over the past decades, QuickBooks has reached dominance in small business accounting with 85% market share. There are over 7 million paid subscribers globally for QuickBooks Online, alongside a broader footprint of over 36 million businesses using some version of QuickBooks.
Historically, Intuit has compounded revenue at a very strong rate. FY2020-FY2025 revenue rose from $7.7B to $18.8B, a roughly 19.6% CAGR. However, the FY2021-FY2022 acceleration was partly acquisition-driven: Credit Karma added roughly 11 percentage points to FY2021 growth and Mailchimp added about 8 points to FY2022. The broader QuickBooks Online ecosystem was the primary organic engine, with a run rate of 13–16%. That supports my assumption of 13% growth initially, fading gradually toward high single digits as Intuit becomes larger.
For perpetual growth, I use 2.5%, which is a long-term expected GBP growth and also a FED’s inflation target rate.
EBITDA margin
You probably noted that in my workings I normally use EBITDA adjusted for SDC expense. This makes a lot of sense given that I am not adjusting the number of shares for dilution, but rather treating SBC expense as real cash expense. This is an acceptable approach used by many analysts.
I model a moderate operating margin expansion of around 300 basis points over the next ten years due to some operating leverage in selling and marketing. R&D expense ratio should remain stable in the mid-teens as the company continues to build out advanced functionalities serving midsize businesses.
EBITDA to NOPAT bridge
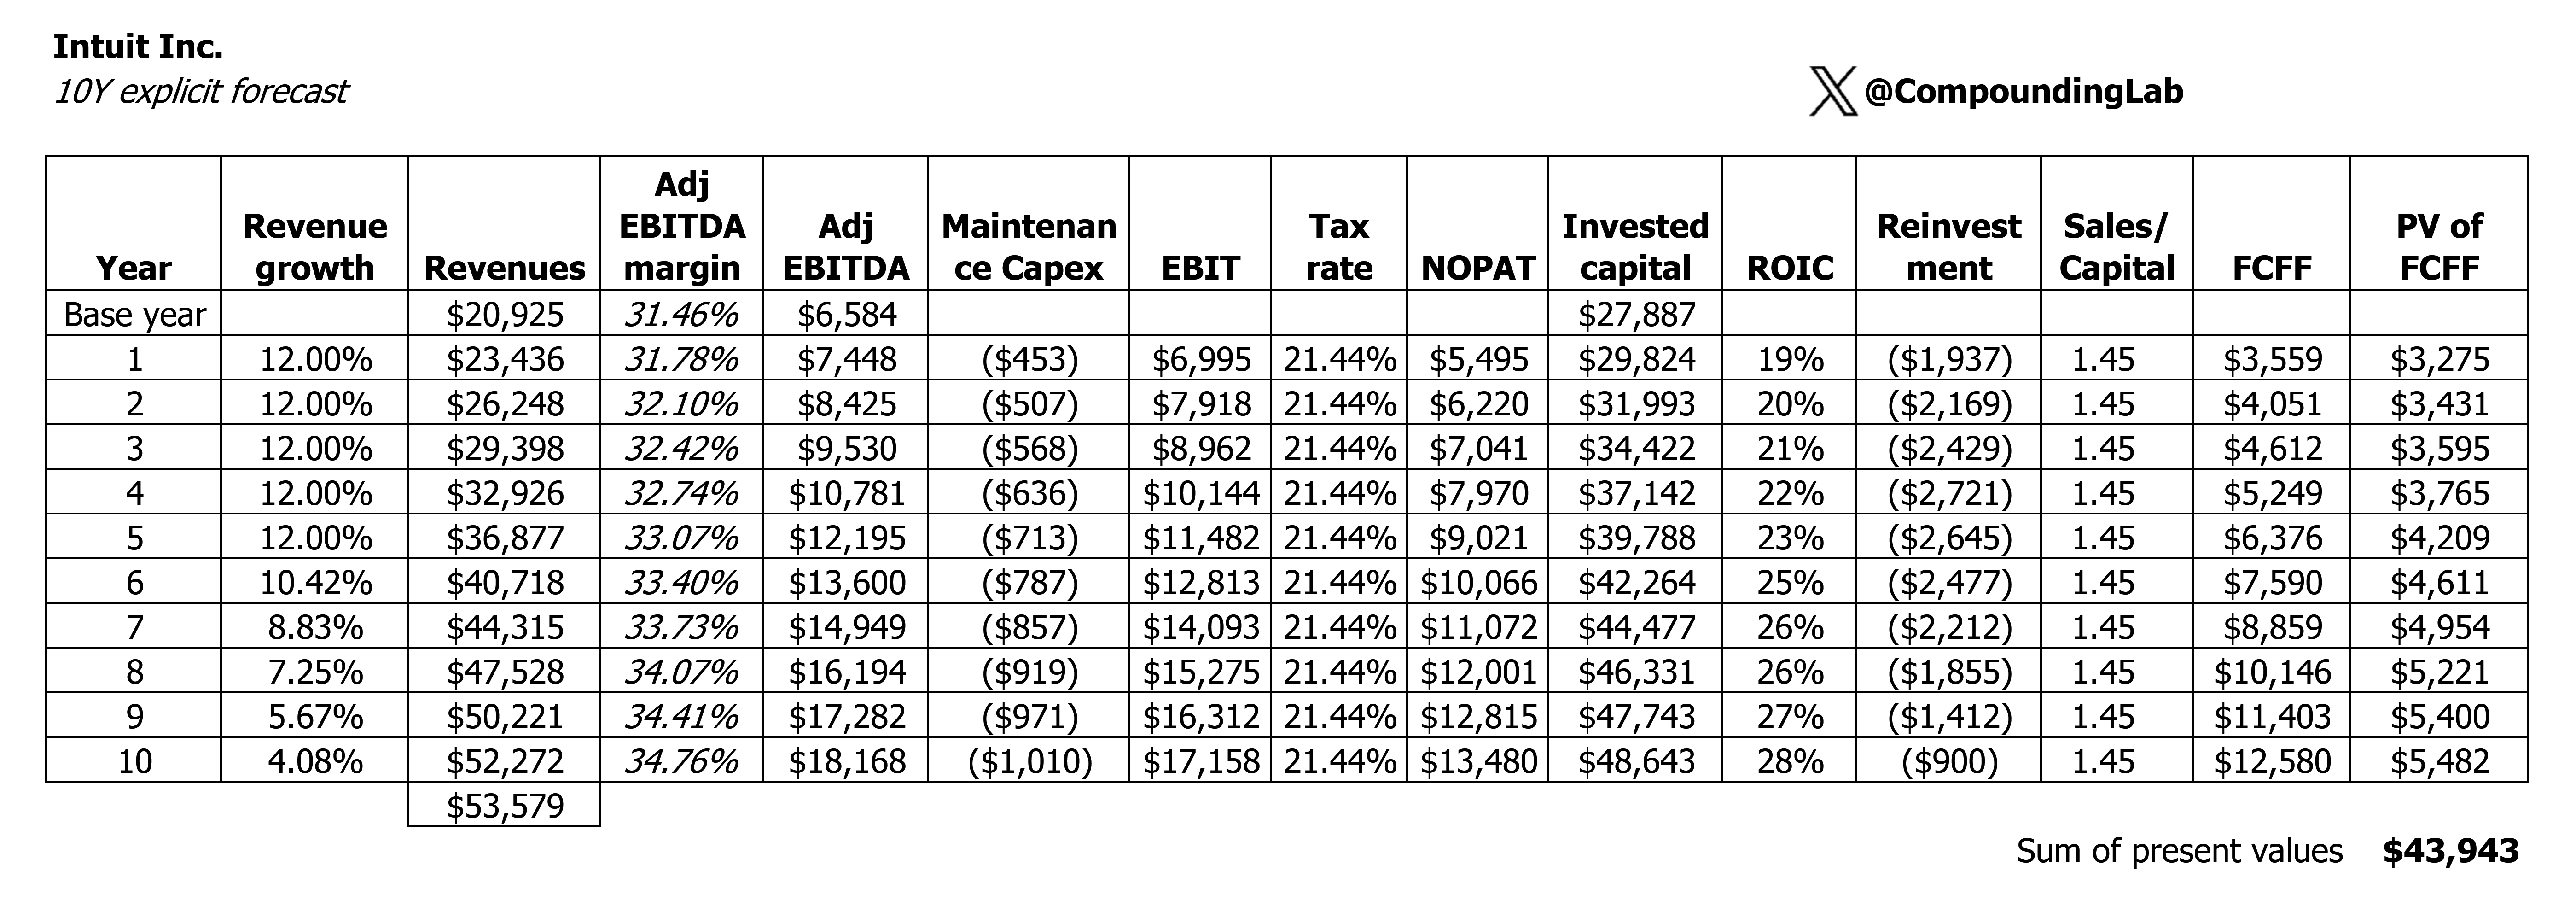
I define maintenance capex as investment required to support current level of operations, and this equals 0.5 of depreciation expense for the INTU 10Y explicit forecast (or a stable capital expenditure ratio of 2%). Growth reinvestment, on the other hand, is defined as reinvestment required to grow operations and depends on the expected Sales/capital ratio. Intuit’s reported aggregate Sales/Invested Capital is only about 0.8x-0.9x in FY2024-FY2025, however this is distorted by roughly $19bn of goodwill and acquired intangibles from past acquisitions. It is not the right number to plug directly into a forward DCF. For my model, I am using a marginal Sales/Capital ratio of 1.45 (defined as revenue to be gained from new investment, not historic cumulative capital efficiency). It is calculated as an average between the company’s historical rate and the Software (System & Application) industry in general.
The tax rate of 21% is a bit above the historical average, but it aligns with the standard rates in the countries where Intuit operates.
Taking all factors into account, I have calculated the unlevered free cash flows for the firm. As a validation step, I compare the UFCF margin to the historical average. Initially, for Year 1 of the forecast, the UFCF margin is 15%, which is lower than the historical average of approximately 22%. However, I find this acceptable since margins can vary from year to year. The spreadsheet shows that by Year 10, the UFCF margin rises to 24%, aligning more closely with the historical average.
ROIC deserves a mention here. From the table with full explicit forecast above, it’s visible that ROIC is improving over time, and by Y10 it will be aligned with the historical average @ 28%. The impact of 2021-2022 acquisitions and resulting goodwill will be mostly offset. Incremental ROIC for new reinvestment is within 37%-47%. This is also aligned with historical ROIC before 2 acquisitions, serving as an additional check that my model is solid.
WACC
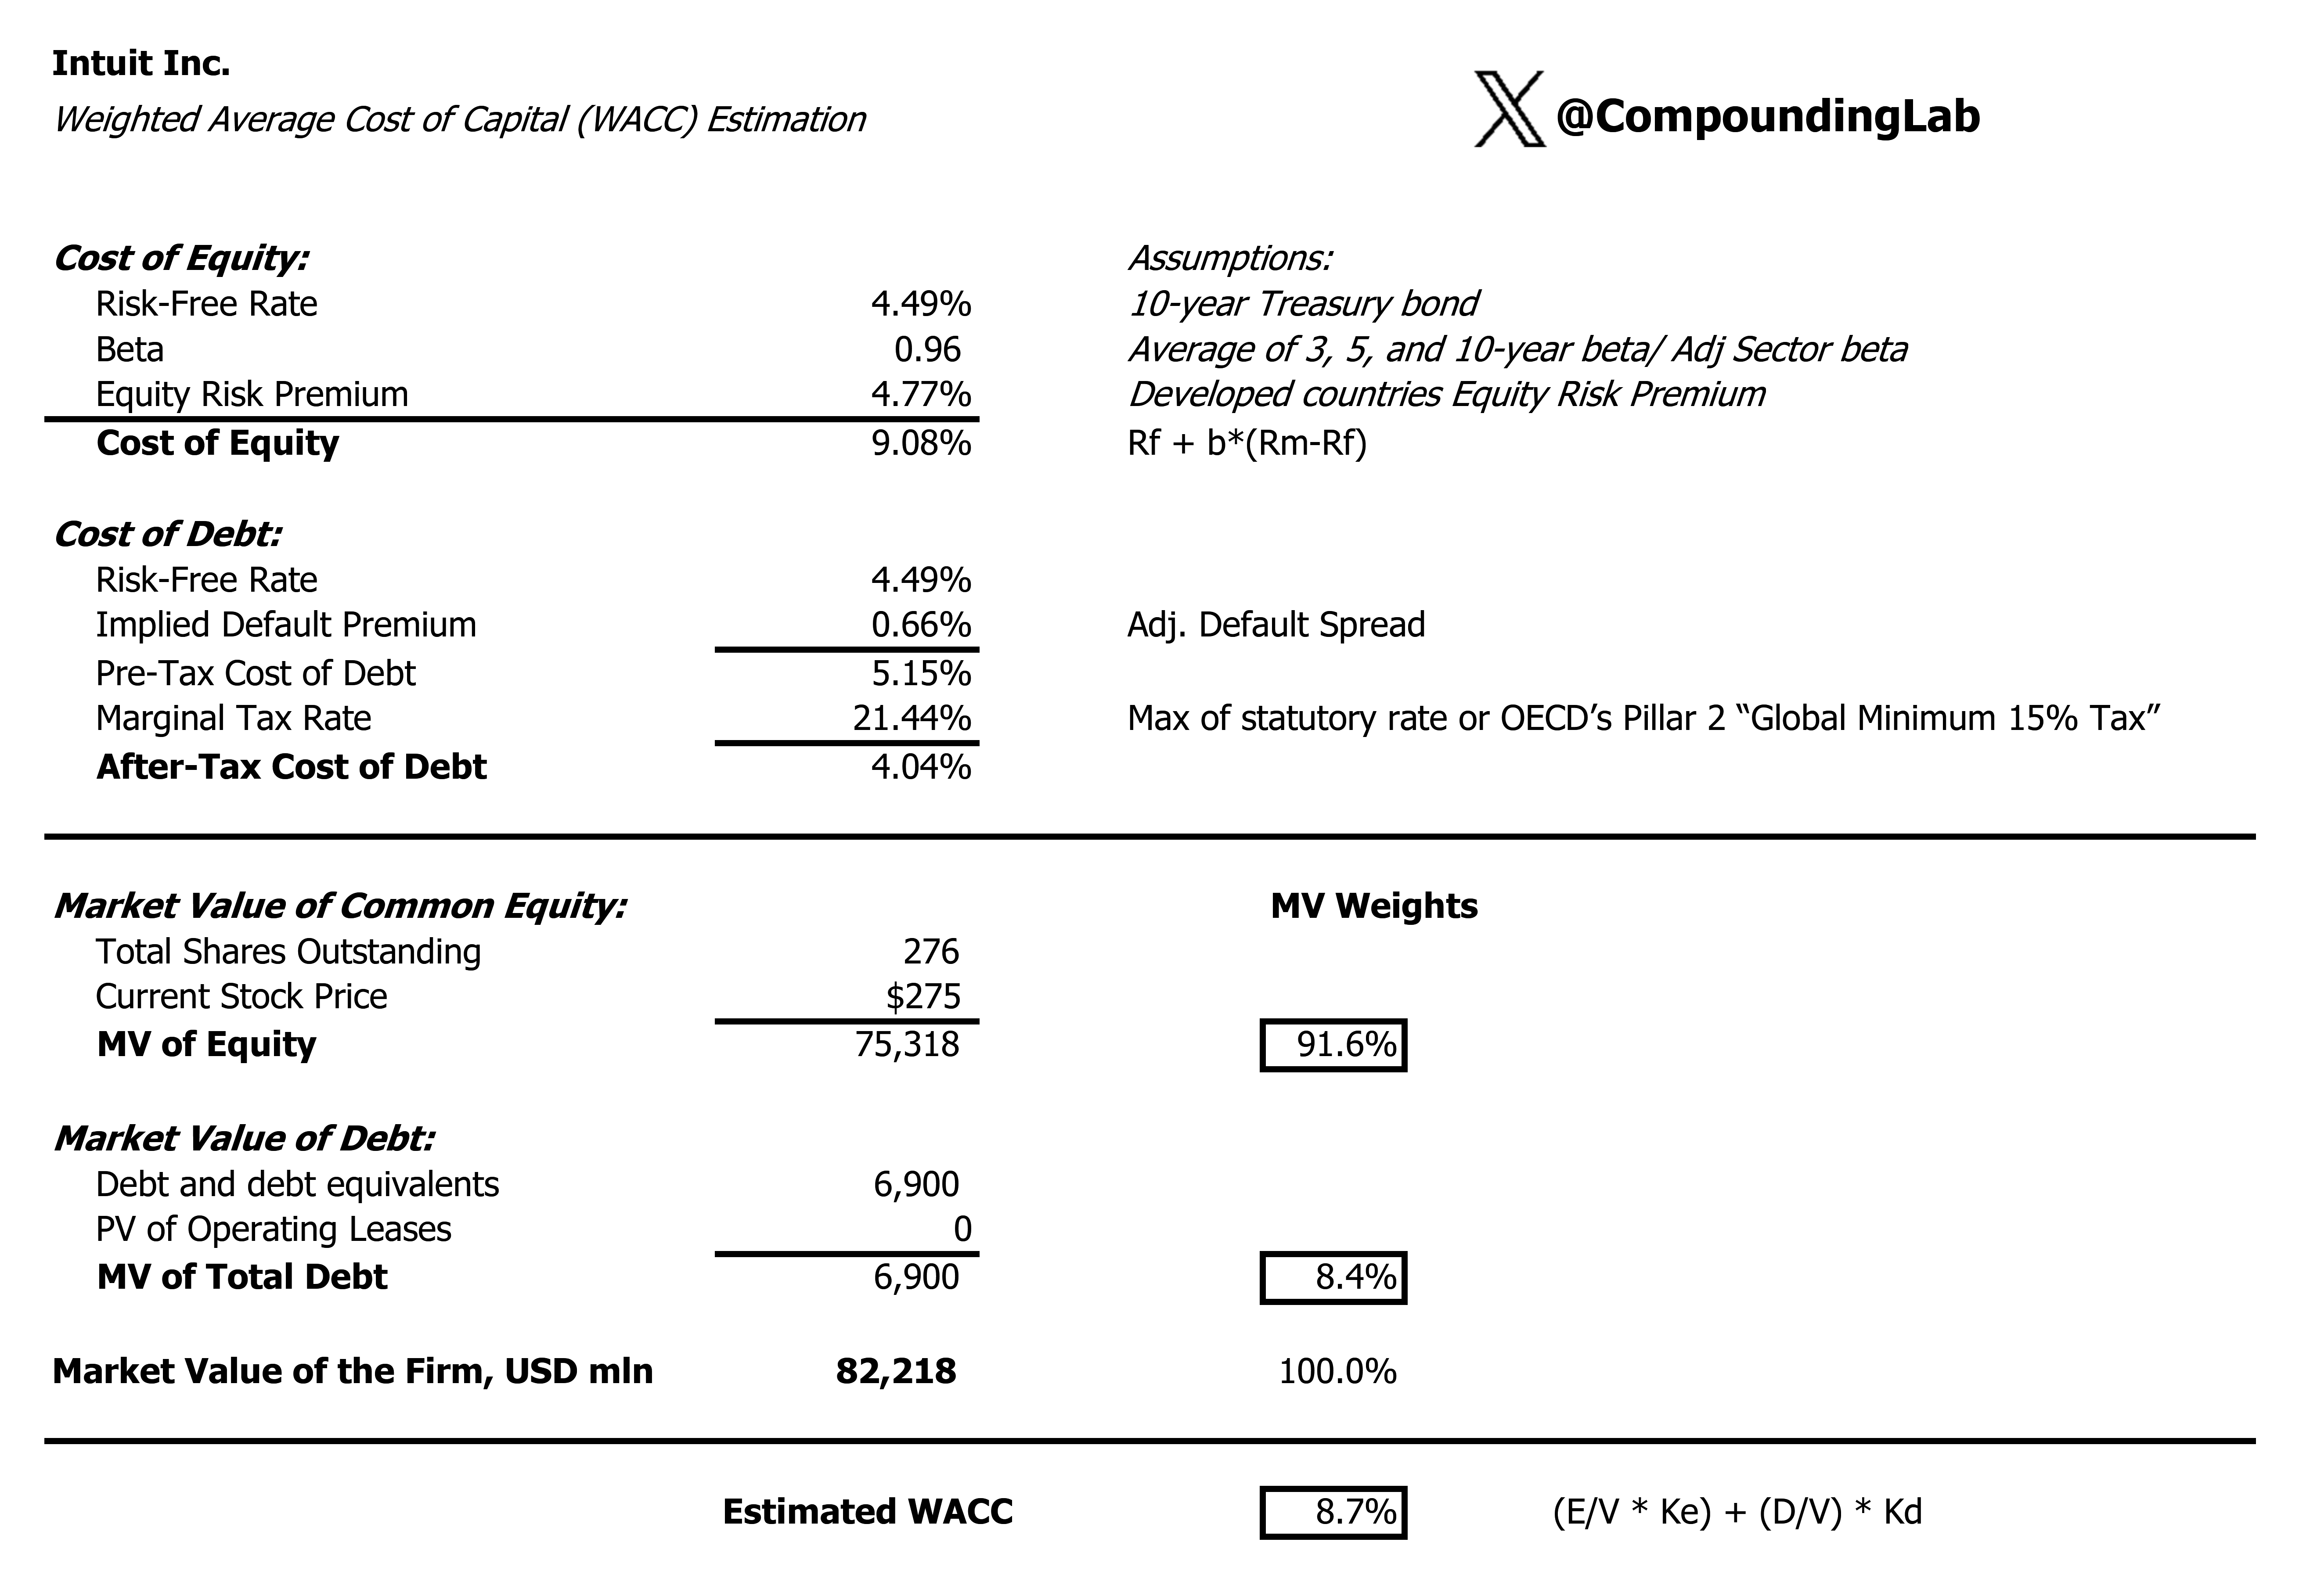
Now I will explain the logic behind my WACC calculation. First, the cost of equity is calculated with CAPM: the 4.49% risk-free rate plus Intuit’s 0.96 beta multiplied by the 4.77% equity risk premium, giving 9.08%. Equity risk premium is 5% as per Damodaran minus default spread for Aa1 rating which is 0.23%, giving us 4.77%.
Second, the pre-tax cost of debt is the same risk-free rate plus Intuit’s 0.66% implied default spread, or 5.15%. IDS at 0.66% is low in absolute terms, but reasonable for Intuit. Intuit was upgraded by S&P to A in October 2025, supported by very low adjusted leverage and strong profitability. That places it among higher-quality investment-grade issuers, where a sub-1% synthetic default spread is normal. Then, applying the 21.44% marginal tax rate produces an after-tax cost of debt of 4.04%.
Third, the capital structure is based on market values: equity is about $75.3bn and debt is $6.9bn, for total firm value of $82.2bn, meaning equity represents 91.6% of financing and debt 8.4%. Finally, these costs are weighted by those market-value proportions: WACC = (91.6% × 9.08%) + (8.4% × 4.04%) = about 8.66%, rounded to 8.7%.
Terminal value
TV is calculated as 2035 NOPAT @ 13,480 divided by WACC @ 8.7%. Since Intuit is a narrow moat, I use NOPAT/WACC formula, and not a value driver formula FCF/(WACC-g). This is because using a value-driver formula is only appropriate with wide-moat companies where growth is expected to create value beyond 10 years from now. For narrow moat companies, it is generally uncertain that they can create value beyond 10 years from now. Since Intuit is a narrow moat, there are no reasons to believe that they can create value from growth beyond 10 years, as they are expected to be a mature company where present value of growth is zero.
Finally, it is worth noting that the PV of terminal value represents 61% of the total enterprise value. This falls within an acceptable range and demonstrates that I am not overly dependent on distant future cash flows.
Moat
Intuit is a narrow moat company due to high switching costs. Before 2026, the company was considered to possess a wide moat, but the rating was revisited recently by analysts mainly because AI increased uncertainty around the durability of its competitive advantages, particularly in tax and software workflows. With artificial intelligence quickly evolving and fundamentally shifting the cost and speed of software development, a narrow moat rating best portrays the strength of switching costs Intuit can enjoy, given all the recent advancements of large language models. My conservative assumptions reflect high uncertainty of the current environment for software stocks, and Intuit in particular.
Base case
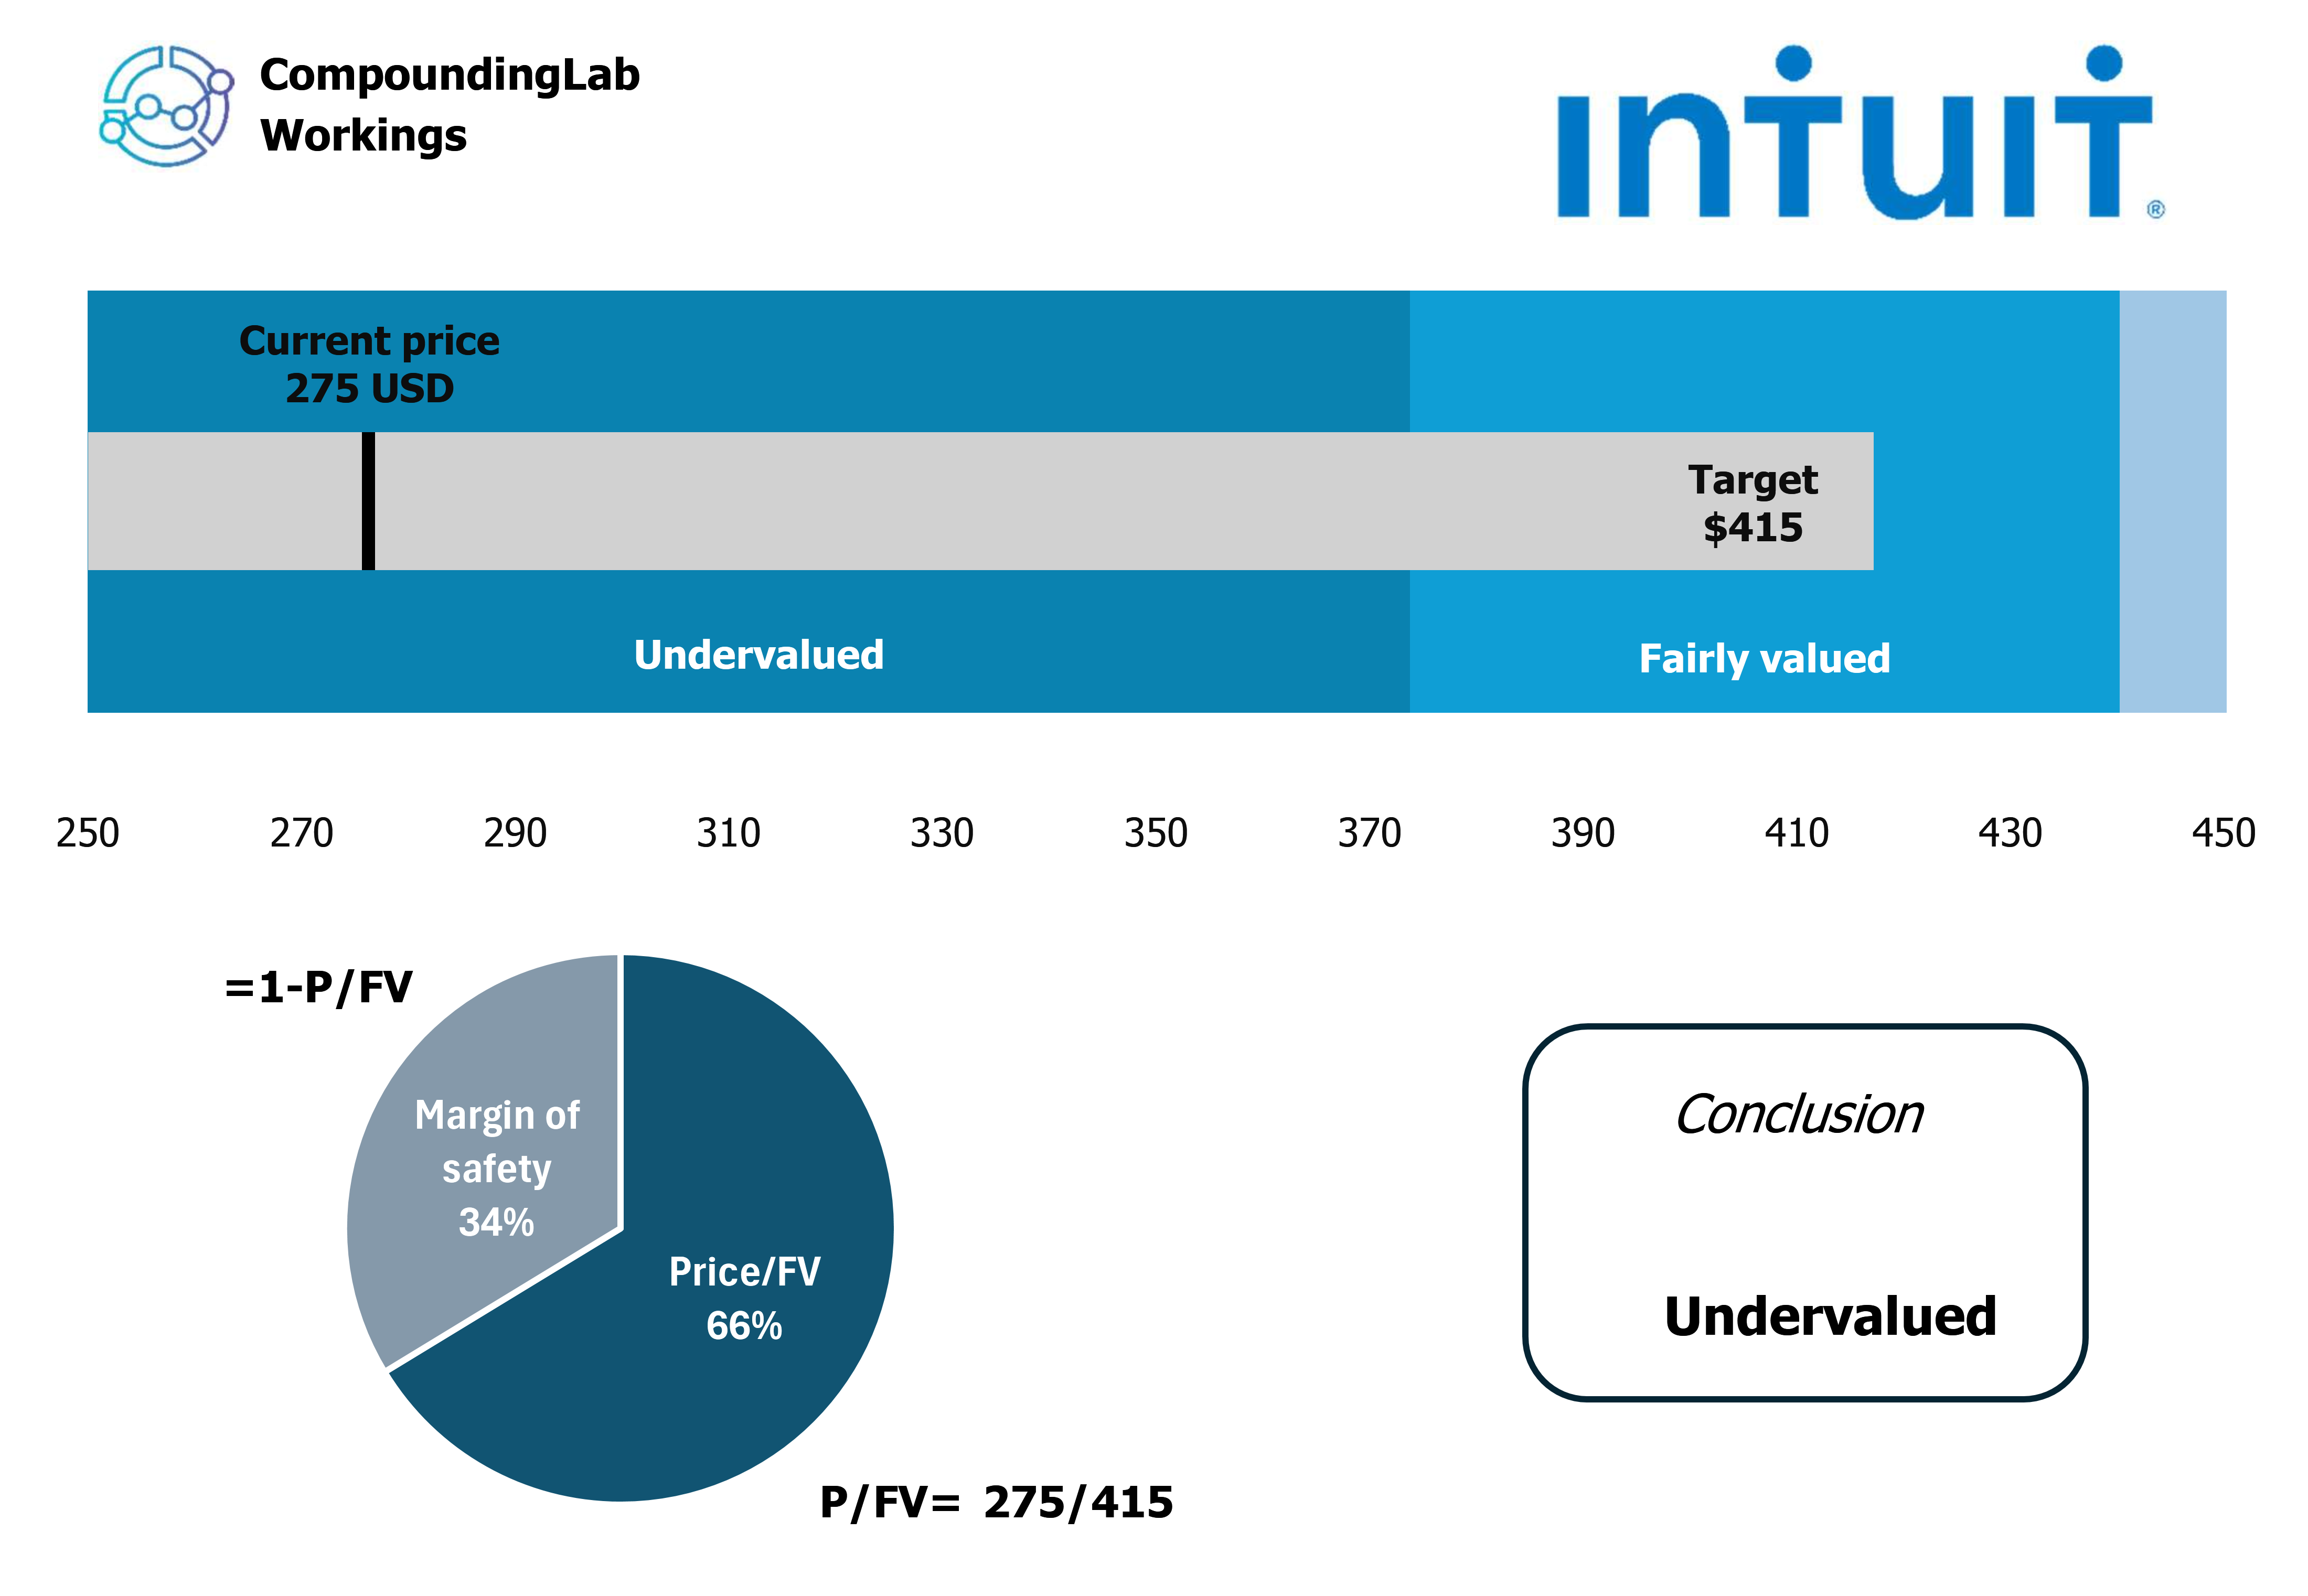
CL price target for Intuit is 275. Valuation suggests that the stock is trading at 34% discount to fair value. If adjusted to FV within 3 years, it will generate 15% in annual alpha.
Sensitivity
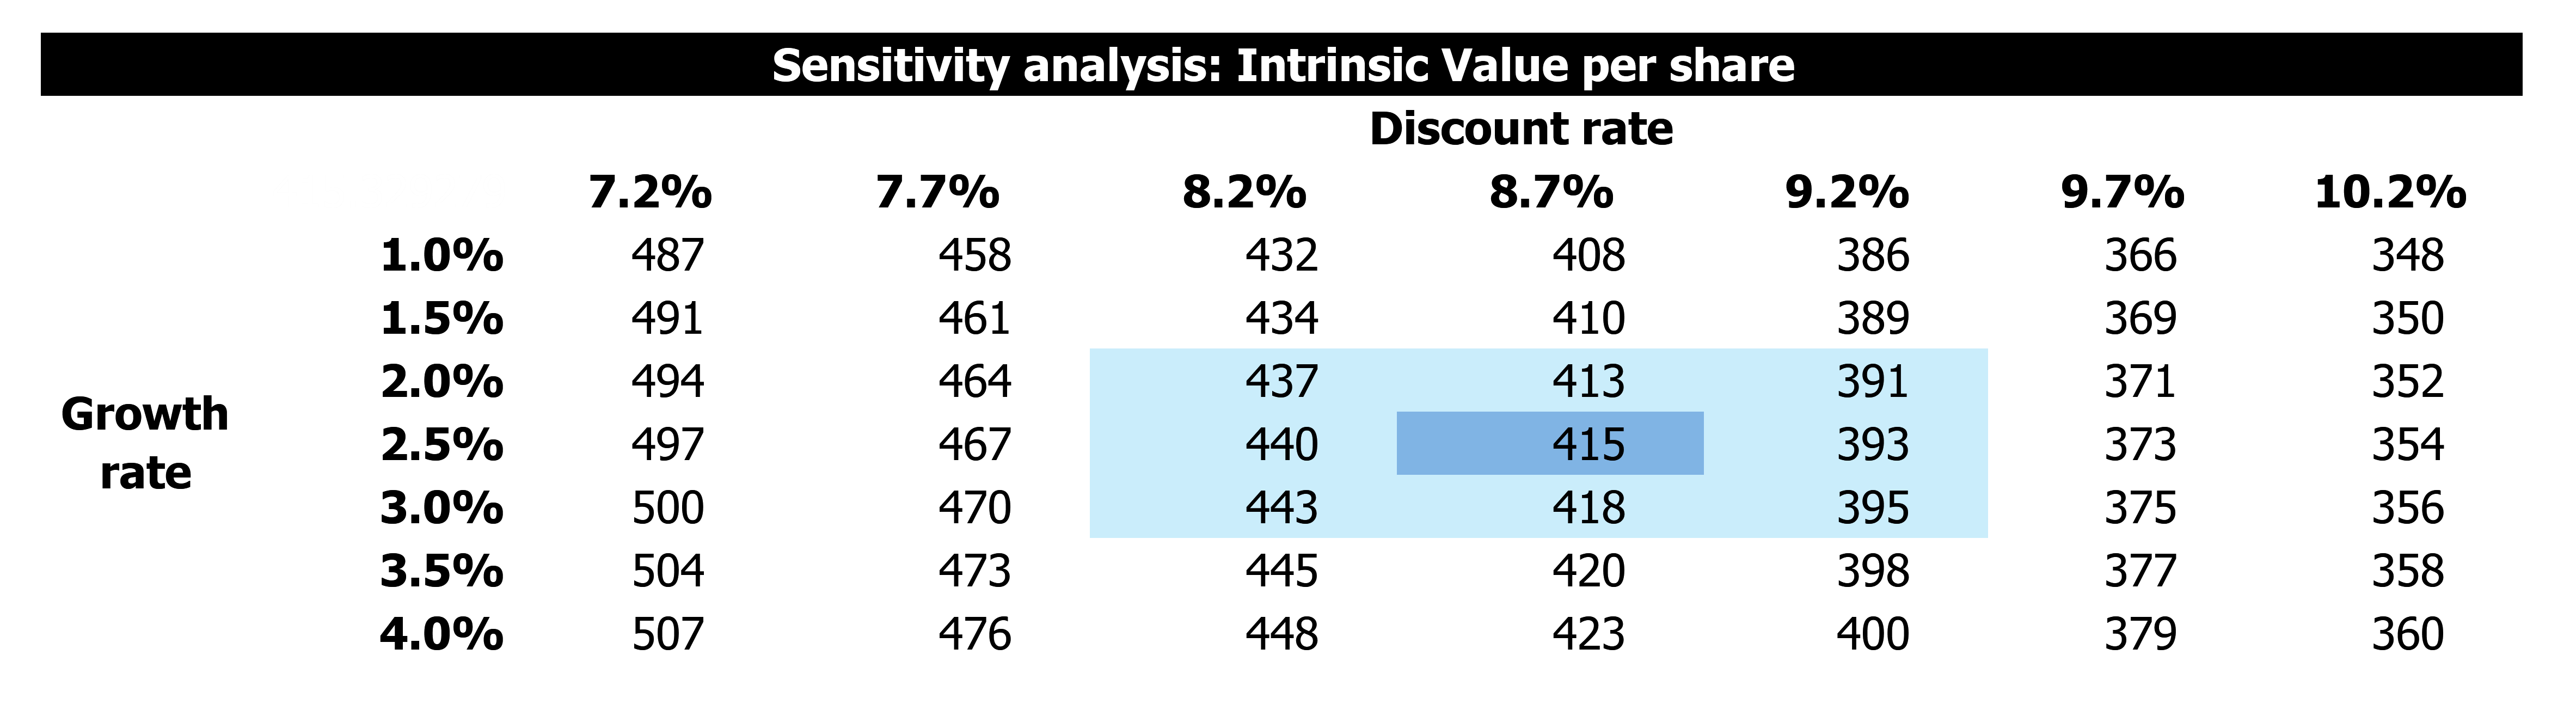
I have prepared sensitivity workings, where you can choose your own assumptions based on the tables below.
Feel free to share this article by pressing the button below so that more people can see it.
Verdict
There are 32 analysts covering INTU stock, with a range of FV estimates anywhere between 275 and 921. CL estimate is somewhere in the middle. Even though shares are decently undervalued by the market and my assumptions are somehow sandbagged, Intuit is not a buy for me. For narrow-moat companies, I normally require a higher discount to FV. I also do not admire the price paid for company’s acquisitions of Credit Karma and Mailchimp. They were the biggest M&A transactions in the software space, but the price/sales multiple of 8 times and 15 times, for Credit Karma and Mailchimp respectively, were relatively high.
Keep in mind that this is an estimate - just like any DCF model. I’m not claiming perfection, but I do trust these calculations to assist with my own investments. Hopefully, they can help inform yours as well. Look at it as a thinking tool, not necessarily as a stock-picking tool.
___________________________________
Disclaimer: This post is for informational and educational purposes only. I do not own shares in INTU and can buy/sell them at any time after this post is published. Not financial advice. Do your own research.
Follow my Substack for regular actionable investing frameworks, incl. a more detailed DCF.