$MU - valuation model

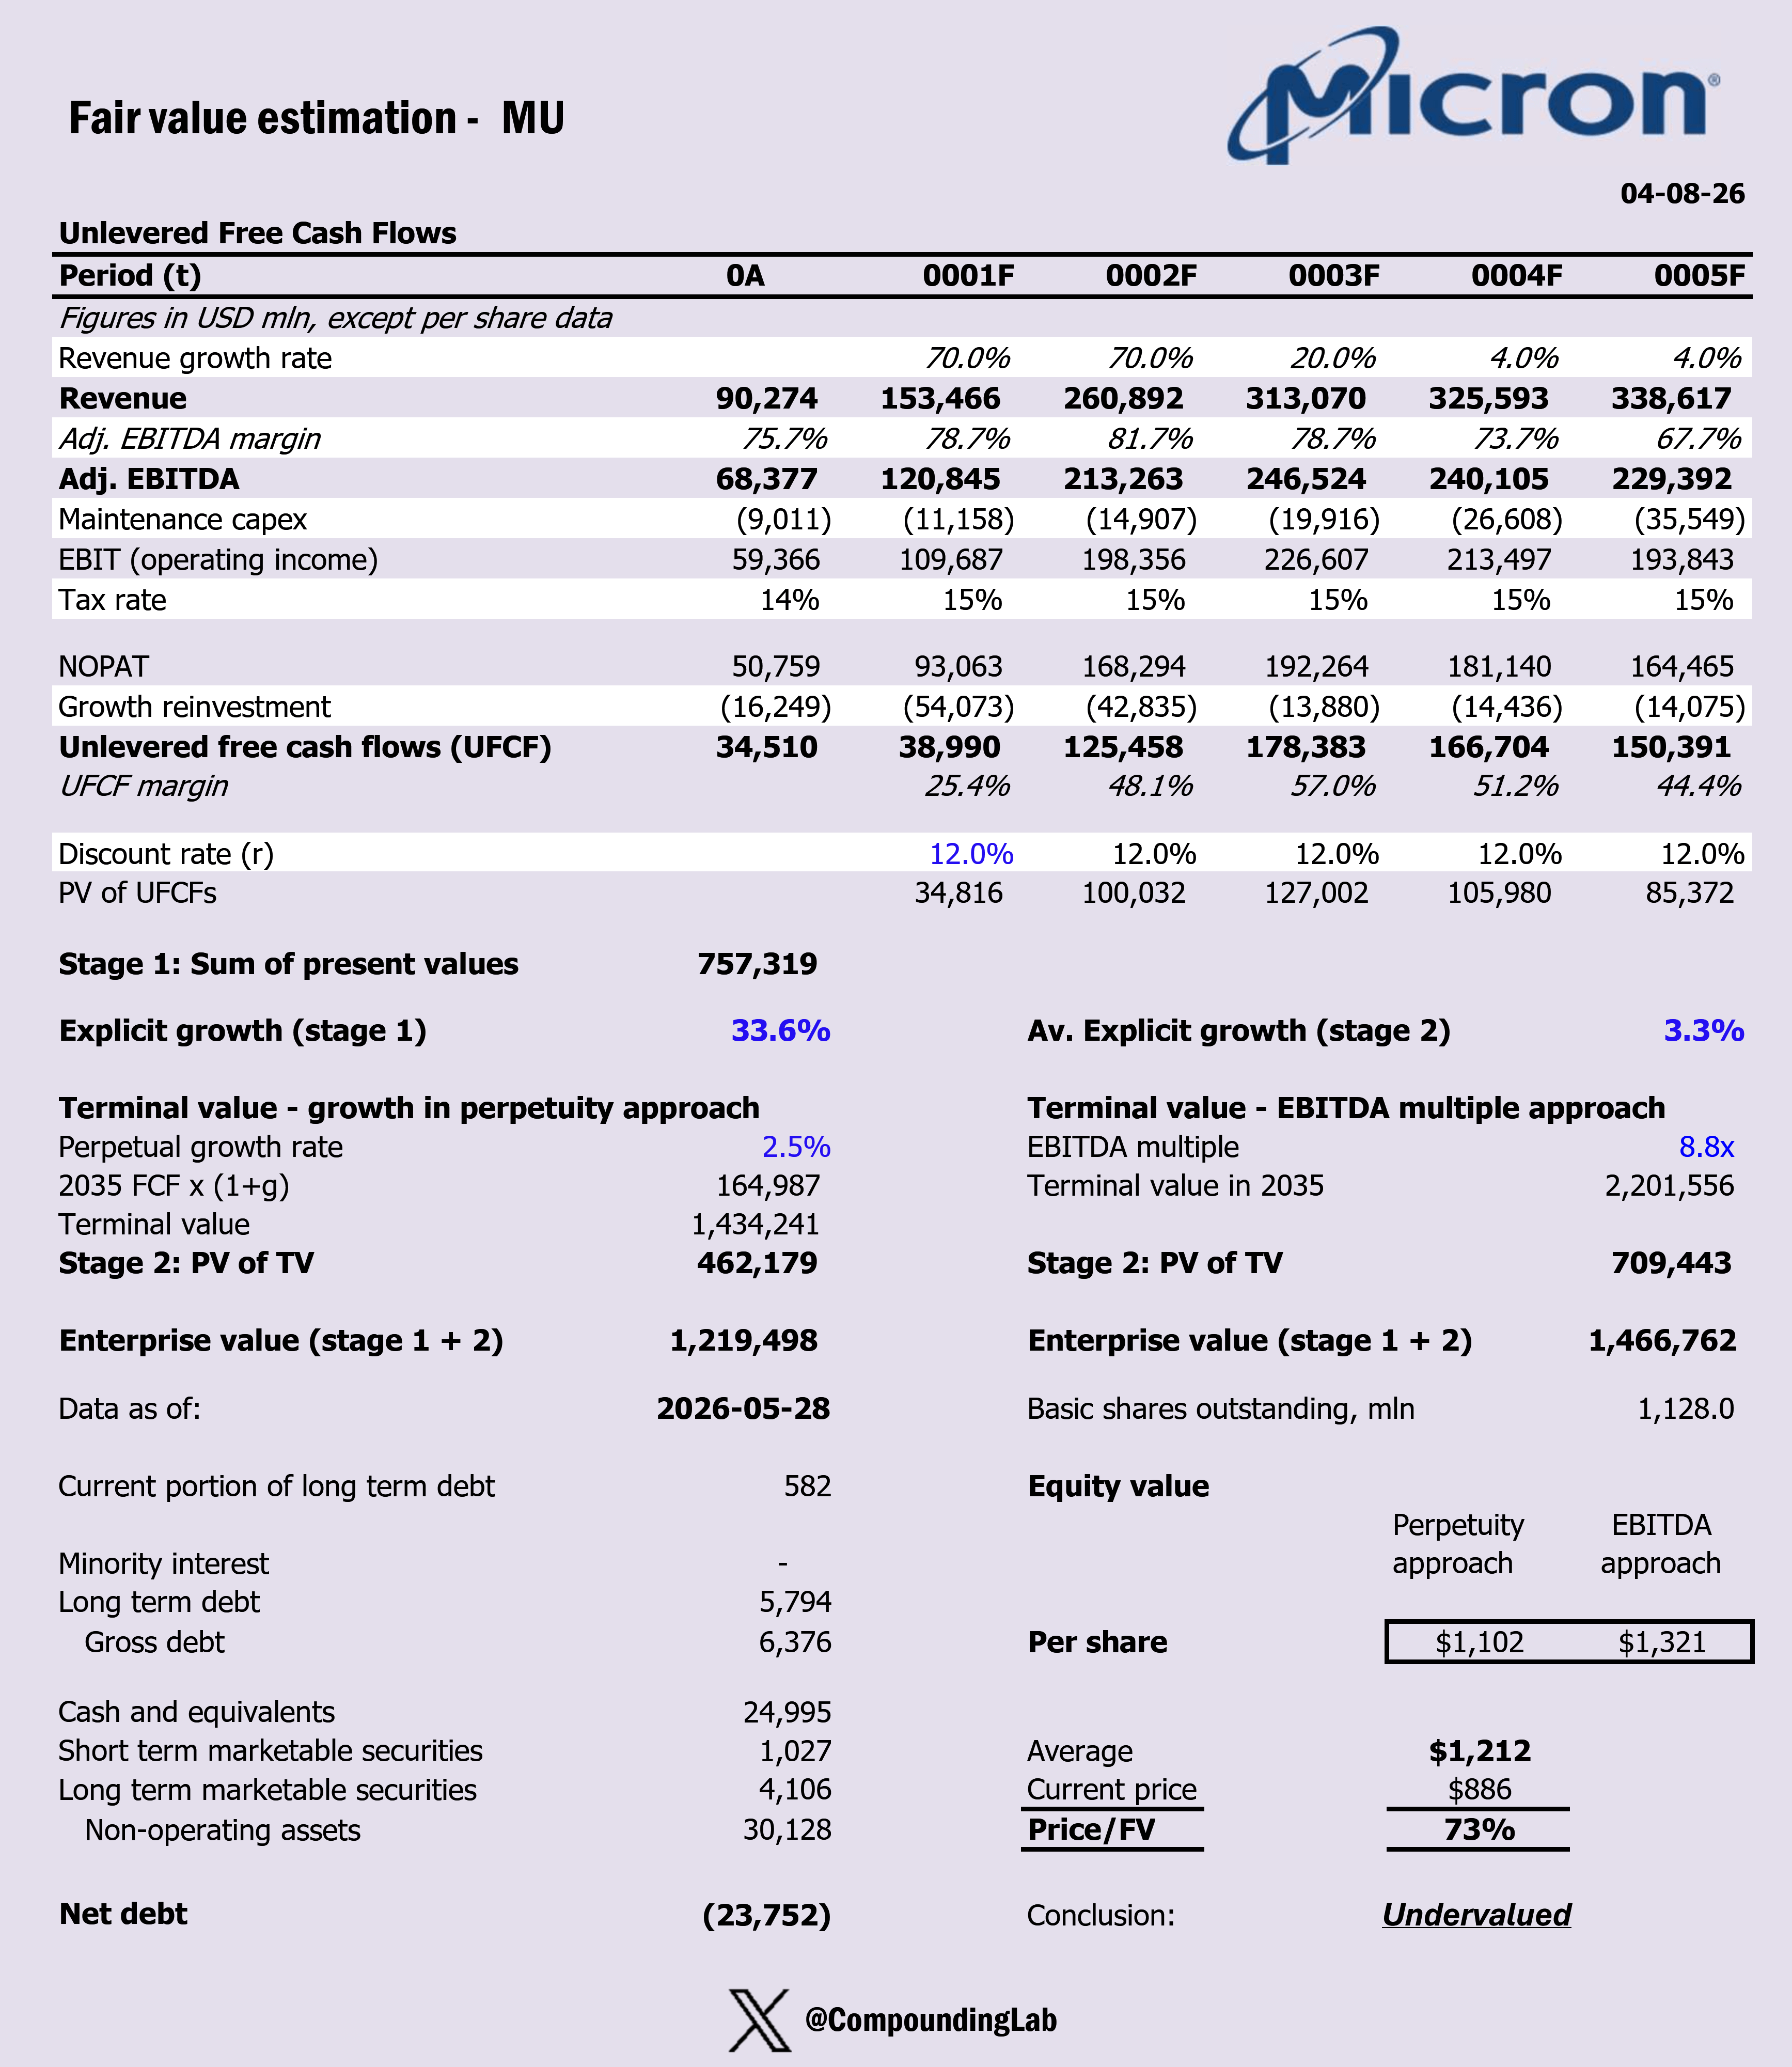
My $MU DCF spit out a number that’s uncomfortable to post. Here’s the model, judge for yourself.
Key assumptions:
Explicit average 5Y/5Y growth @ 33.6%/3.3%
Long-term growth in perpetuity @ 2.5%
Record high 70-80% EBITDA Margin but fading towards more reasonable long-term range in Y10
WACC @ 12%
Adj. EBITDA exit multiple of 8.8
Tax rate 15% - in line with OECD’s Pillar 2 “Global Minimum Tax”
The input that drives reinvestment in Y3 onwards is the most recent Sales to Capital ratio = 0.9, in line with the Semiconductor average rate, with much higher rate in Y1 and Y2 due to tailwind
Micron Technology has become one of the clearest beneficiaries of the AI infrastructure boom, and one of the most difficult stocks to value.
The shares are down roughly 30% from their peak even as Micron produces record results and high-bandwidth-memory demand remains strong.
That apparent contradiction is exactly why I built my DCF.
The valuation looks attractive. The investment decision is harder.
Why is Micron down 30% from its peak?
The simplest answer is that Micron’s results are excellent, but expectations became even more extreme.
Memory stocks are not valued only on current earnings. They are valued on what investors think supply, pricing and utilization will look like several years ahead. When spot prices, contract prices and margins approach record territory, the market immediately begins looking for the next supply response. That is the uncomfortable feature of commodity-like semiconductor cycles: the best reported numbers can coincide with the moment investors start worrying about peak earnings.
Four concerns appear to be driving the correction.
First, investors are taking profits after an extraordinary run. A sharp correction does not require collapsing fundamentals; it only requires expectations to stop accelerating.
Second, the market is worried about future industry capacity. Samsung, SK Hynix and Micron are investing heavily, while China’s CXMT is expanding its DRAM presence. The key risk is whether capacity added in response to today’s shortage produces excess supply in 2027 or 2028.
Third, AI capital expenditure has become a crowded assumption. Any sign of slower data-centre deployment can hit memory suppliers disproportionately because their operating leverage works in both directions.
Finally, current profitability is clearly above a normalized level. Micron reported a 74.4% GAAP gross margin in fiscal Q2 2026 and guided to approximately 81% for Q3. Those are astonishing economics for a historically cyclical manufacturer. The market is not questioning whether they are real; it is questioning how long they can last. That distinction matters enormously in a DCF.
Forward growth rate
As always, my model uses a ten-year explicit forecast split into two stages.
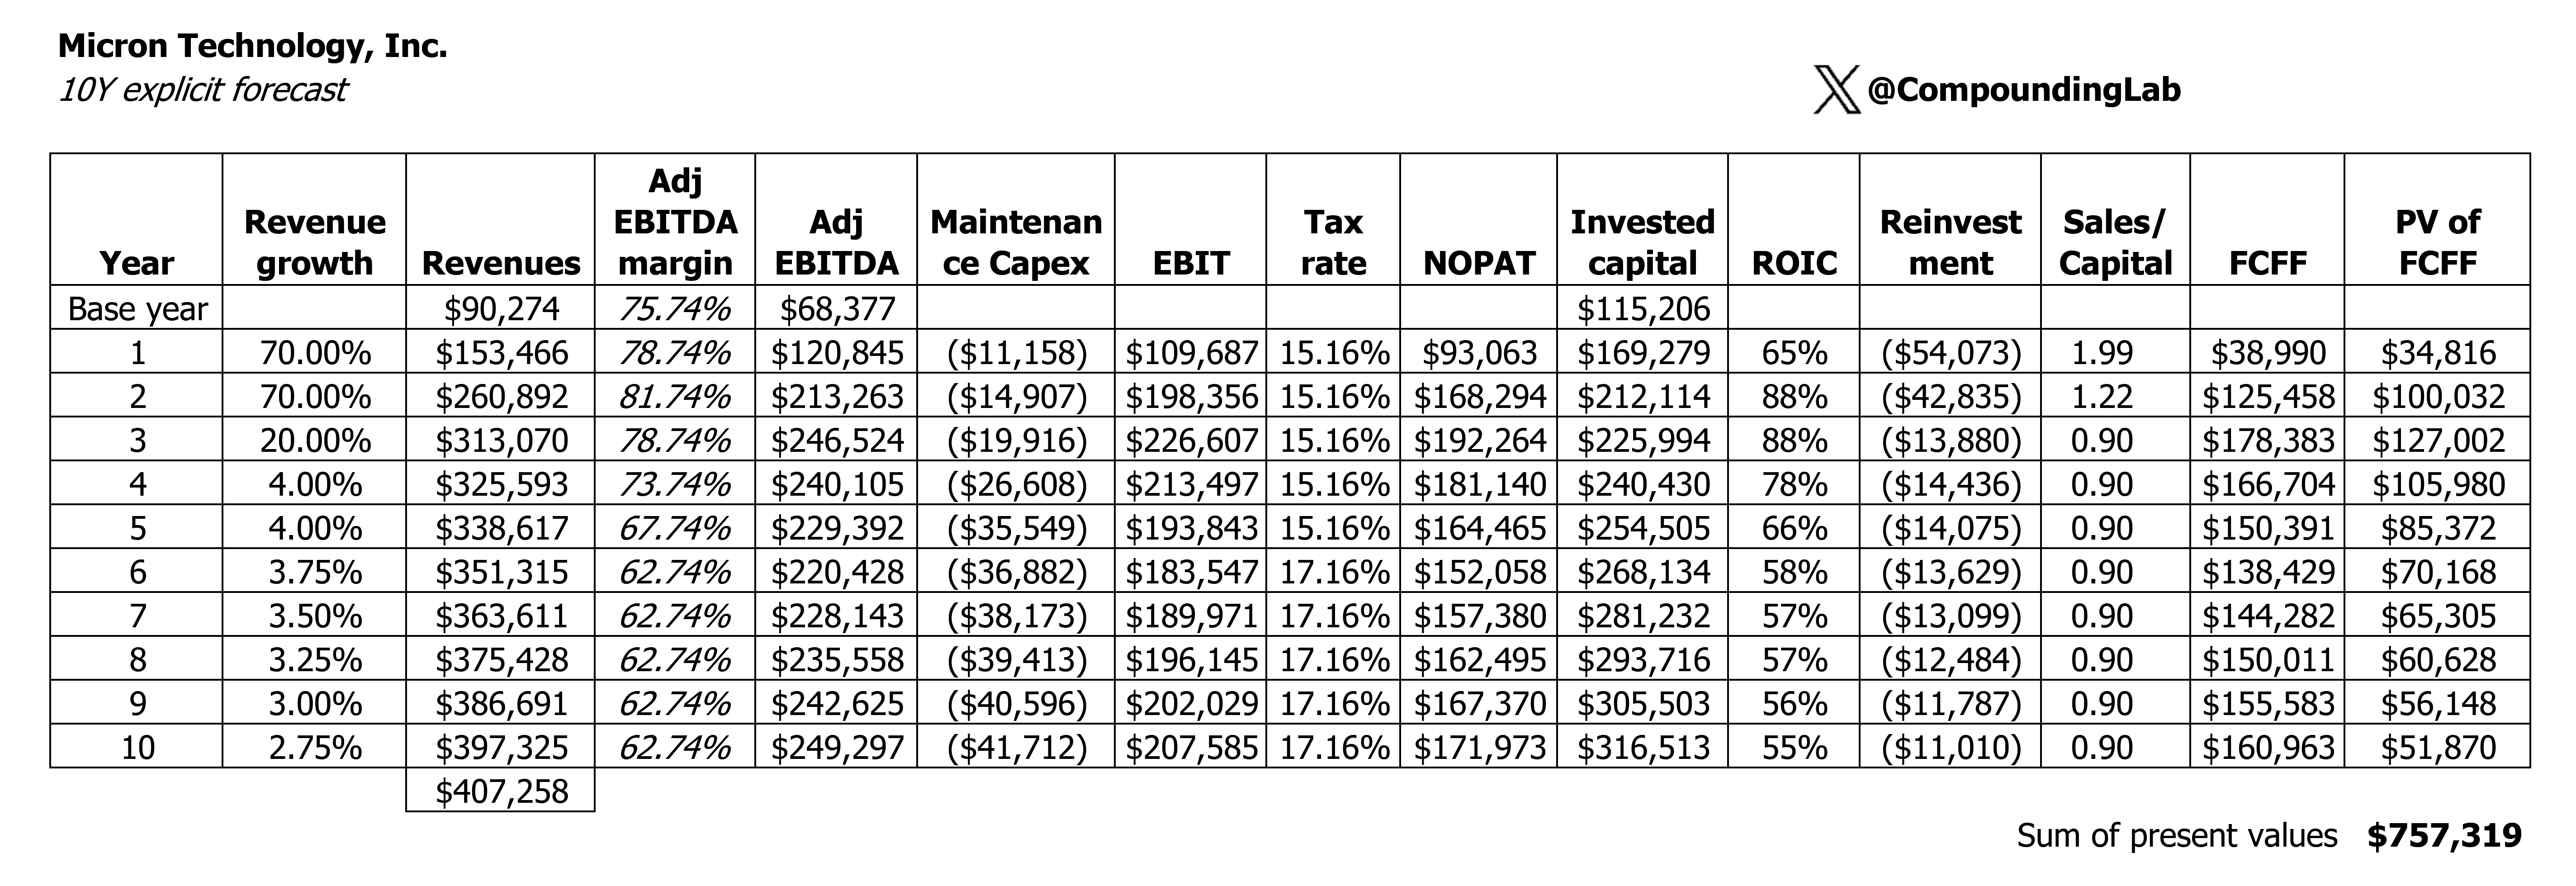
During the first five years, average explicit revenue growth is 33.6%. This figure is heavily front-loaded: I model revenue growth of 70% in Year 1 and Year 2, 20% in Year 3, and 4% in Years 4 and 5. The shape matters more than the average. I am not assuming Micron compounds at 33.6% in a smooth line; instead, I am modelling a powerful shortage-and-pricing cycle followed by rapid normalization.
For Years 6–10, average growth falls to 3.3%, with annual growth fading from 3.75% to 2.75%. My perpetual growth rate is 2.5%, which is broadly consistent with a mature global business growing around long-run nominal economic output. I do not give Micron perpetual AI-like growth.
My revenue forecast rises from a base of $90.3 billion to $153.5 billion in Year 1, $260.9 billion in Year 2, and $313.1 billion in Year 3. After that, the curve flattens materially, reaching $338.6 billion in Year 5 and $397.3 billion in Year 10. Keep in mind, those are not calendar years or reporting years. Timespan is a year from today based on twelve trailing month (TTM), since we are already in the middle of 2026. Instead of adjusting for mid-year Convention, I am just utilizing forward 12 months values.
This forecast assumes that AI changes the size of the memory profit pool, not that it abolishes cyclicality. HBM consumes substantially more wafer capacity per bit than conventional DRAM and requires advanced packaging, thermal management and tight integration with accelerators. That can keep effective supply tighter than headline wafer additions suggest. At the same time, large customers will qualify alternative suppliers, suppliers will improve yields, and capital will chase high returns. My fade period is designed to capture both realities.
EBITDA to FCF bridge
The model begins with an adjusted EBITDA margin of 78.7%. It peaks at 81.7% in Year 2, in line with exceptional near-term memory conditions, then falls to 78.7% in Year 3, 73.7% in Year 4, and 67.7% in Year 5. By Year 6, I reduce it to 62.7% and hold it there through Year 10.
This is one of the most important choices in my valuation. HBM has better pricing, greater technical complexity and tighter customer qualification than conventional memory. It can structurally improve Micron’s mix. But no serious long-duration model should capitalize an 80% margin forever in an industry where supply additions, node transitions and customer bargaining power eventually restore competition.
EBITDA is not cash flow, particularly for a semiconductor manufacturer.
My bridge begins with adjusted EBITDA, then deducts maintenance capital expenditure to estimate EBIT. In Year 1, adjusted EBITDA of $120.8 billion becomes EBIT of $109.7 billion after $11.2 billion of maintenance capex. Applying the 15.16% tax rate produces NOPAT of $93.1 billion.
I then deduct growth reinvestment of $54.1 billion, resulting in unlevered free cash flow of $39.0 billion. In Year 2, the same bridge produces $168.3 billion of NOPAT, $42.8 billion of reinvestment, and $125.5 billion of free cash flow. By Year 10, normalized adjusted EBITDA of $249.3 billion translates into $172.0 billion of NOPAT and $161.0 billion of free cash flow.
Micron must fund fabrication, process migration and advanced packaging before shareholders receive the residual.
From Year 3 onward, my growth-reinvestment input is a 0.9× sales-to-capital ratio, broadly in line with the semiconductor industry average. In other words, each additional dollar of revenue requires roughly $1.11 of incremental invested capital. I use higher ratios in Years 1 and 2: 1.99× and 1.22×, respectively, because pricing and utilization create an unusually powerful revenue tailwind before the full capital bill arrives. From Year 3, I normalize the ratio to 0.9× and keep it there.
Across the explicit period, the present value of forecast free cash flows is $757.3 billion. The terminal value contributes the balance, which is why the margin fade, reinvestment rate and discount rate matter far more than a single year of headline EPS.
WACC
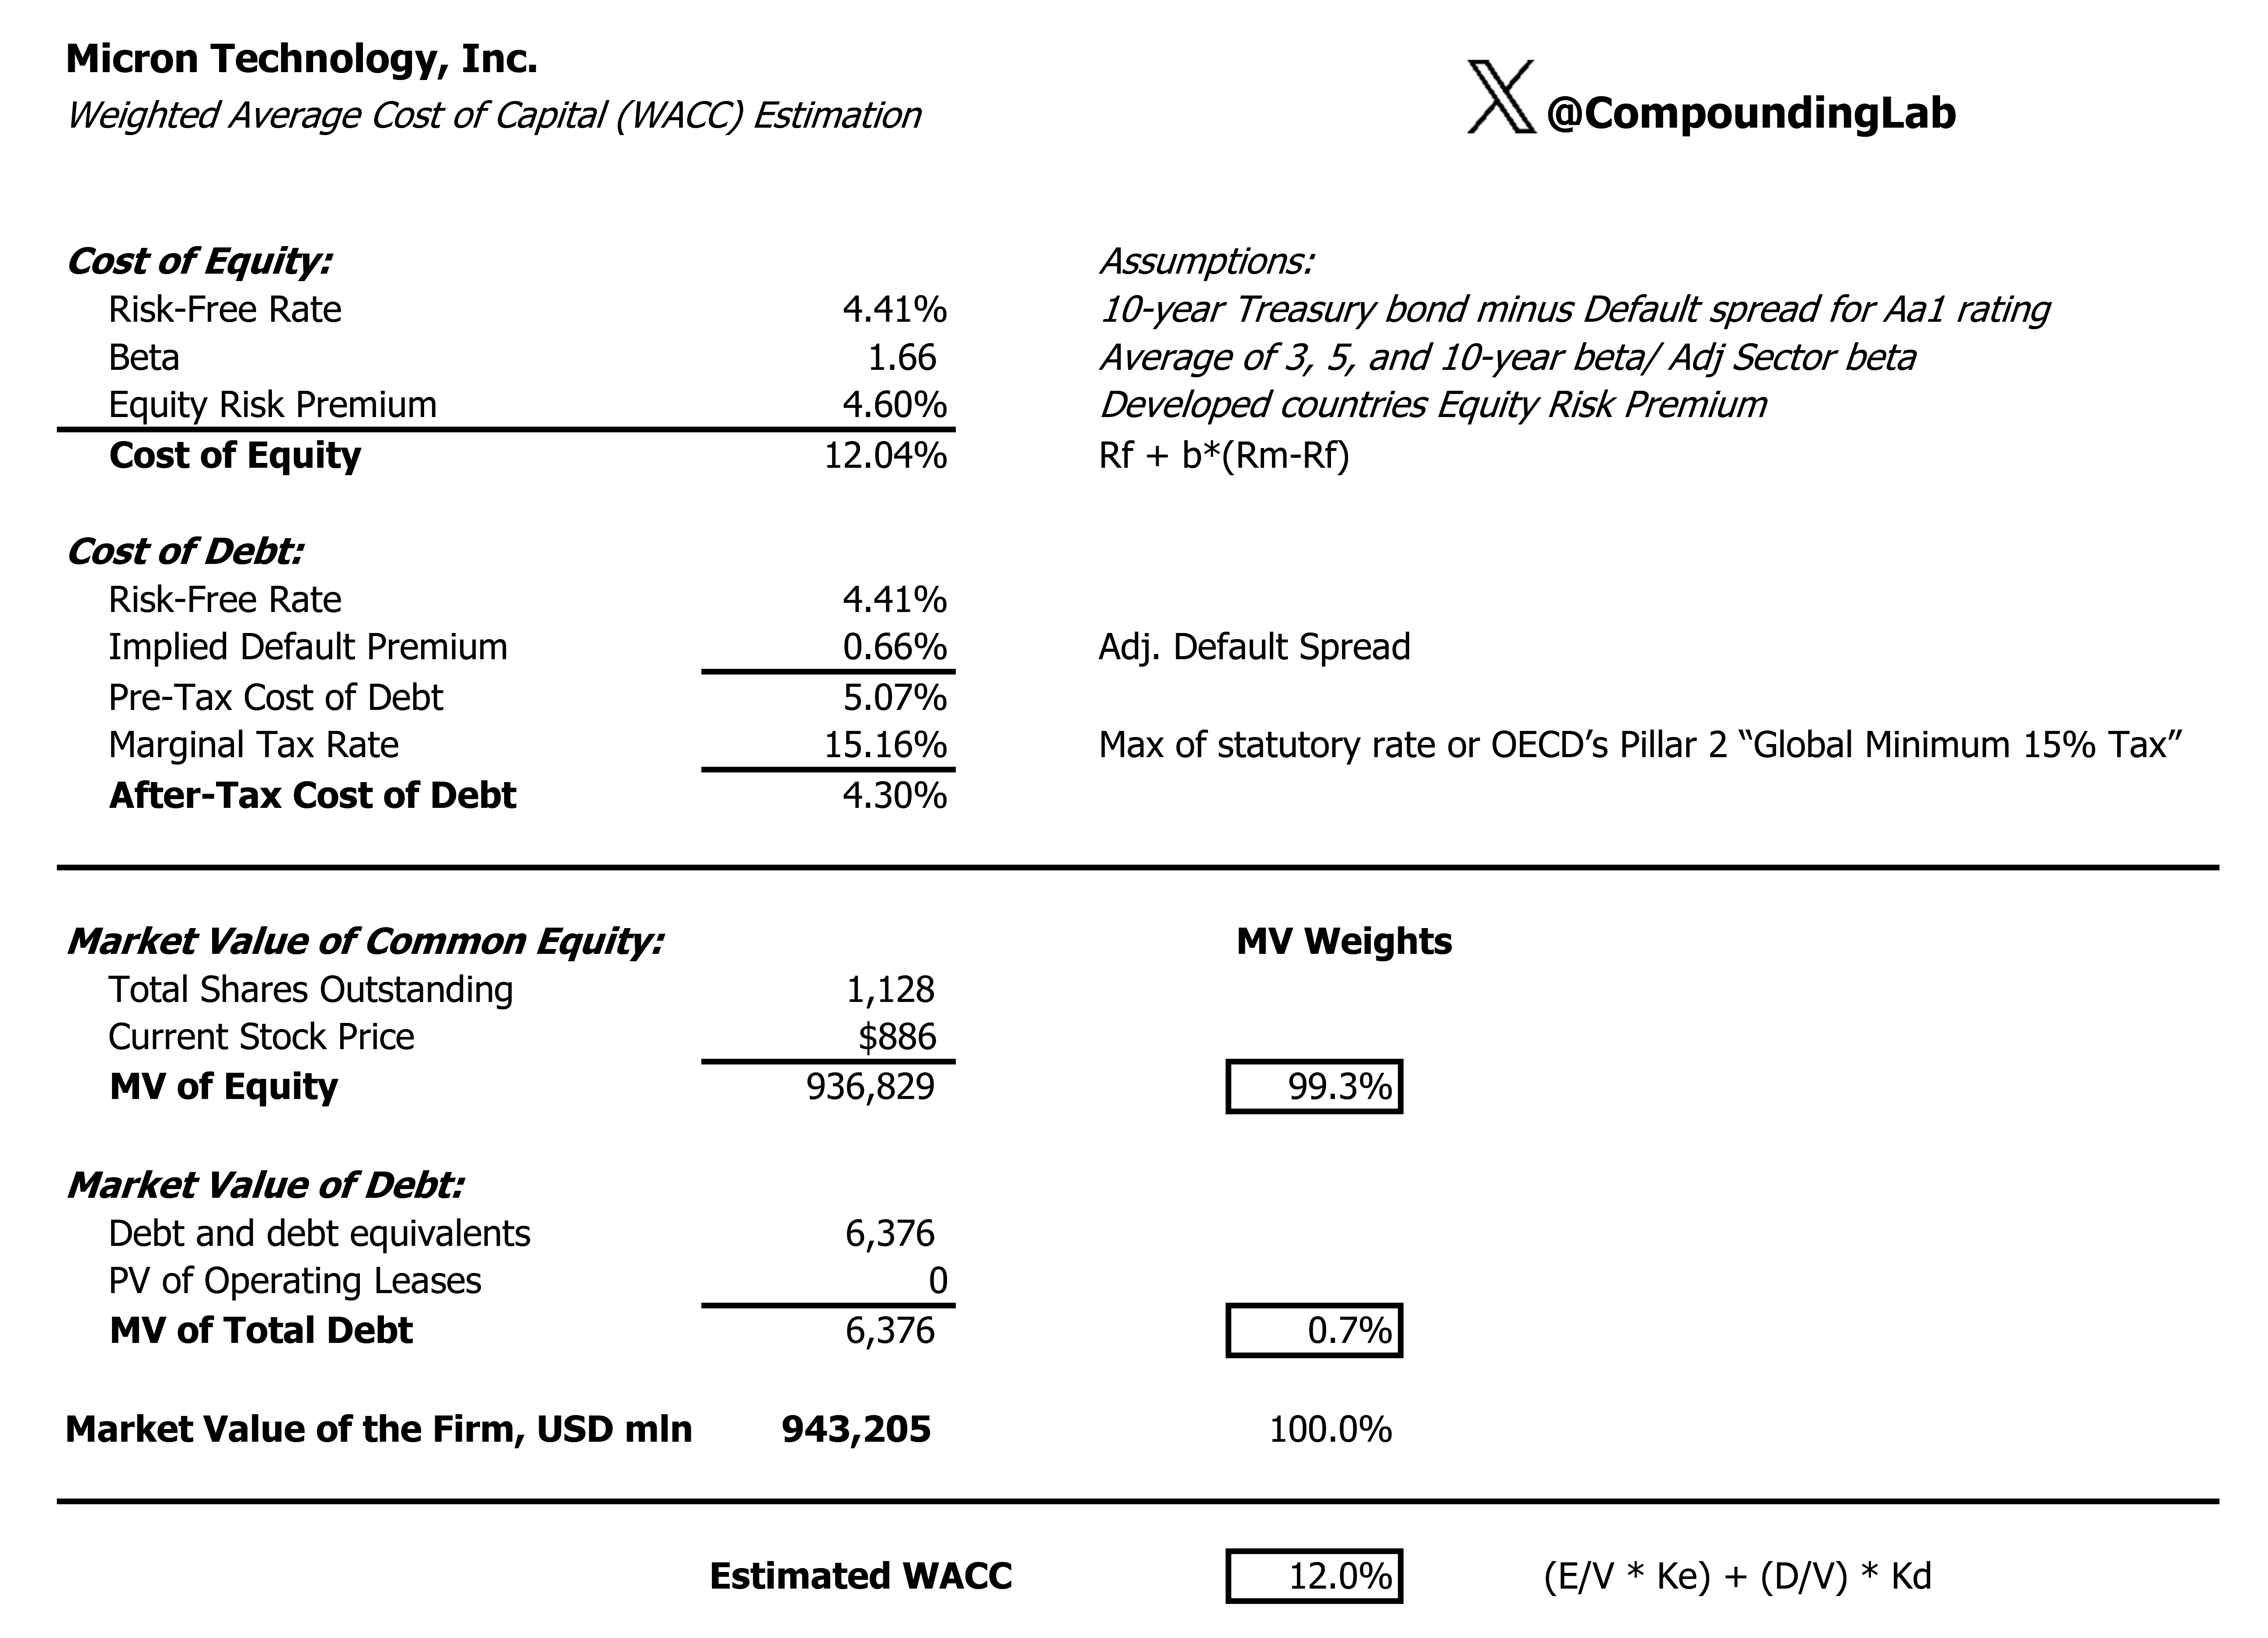
I use a 12% WACC. My cost of equity is 12.04%, based on a 4.41% risk-free rate, a normalized beta of 1.66 and a 4.60% equity risk premium. The after-tax cost of debt is 4.30%, but debt represents only 0.7% of enterprise financing in my calculation, so Micron’s WACC is effectively its cost of equity. The high discount rate is intentional: it reflects both the stock’s volatility and the uncertainty of forecasting cash flows through a memory cycle.
Tax rate
I apply a 15.16% tax rate during the first five forecast years, close to the OECD Pillar Two 15% global minimum tax framework. My detailed table then moves to 17.16% in Years 6–10, adding some conservatism as the business normalizes and the benefit from current geographic and tax arrangements becomes less certain.
For my terminal value, I use an average from two methods. The perpetual-growth approach produces $1,102 per share, while an 8.8× adjusted EBITDA exit multiple produces $1,321 per share. I average the two outcomes rather than allowing either terminal method to dominate the conclusion. That gives me my final target of $1,212.
Does Micron have an economic moat?
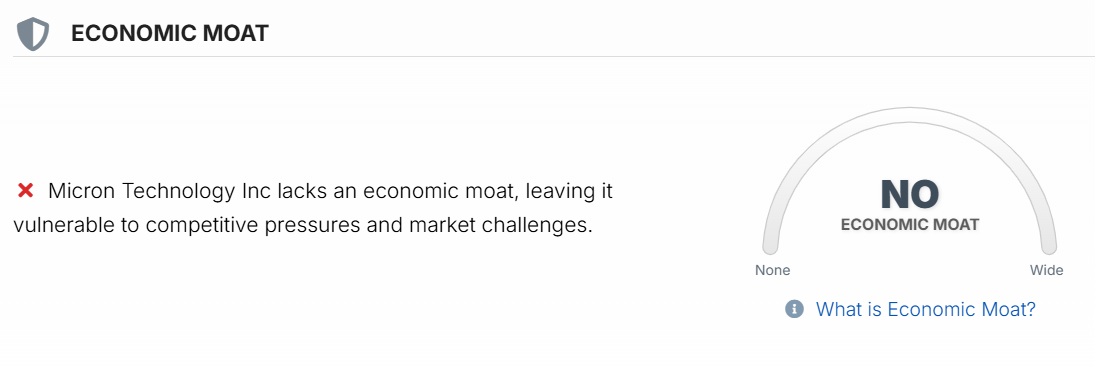
General analysts’ consensus is that Micron has no durable economic moat, although it possesses some competitive strengths. The company operates at the technological frontier, benefits from immense barriers to entry, has qualified relationships with major customers and is one of only three scaled global DRAM producers. HBM also creates stickier design and qualification cycles than standard memory. However, a moat should protect returns on capital across a full cycle. Micron still sells products exposed to industry supply, pricing and utilization; customers can dual-source and rivals can respond with capacity and process improvements. The industry is concentrated, but concentrated does not automatically mean protected. I therefore refuse to value peak returns as permanently defensible.
Base case
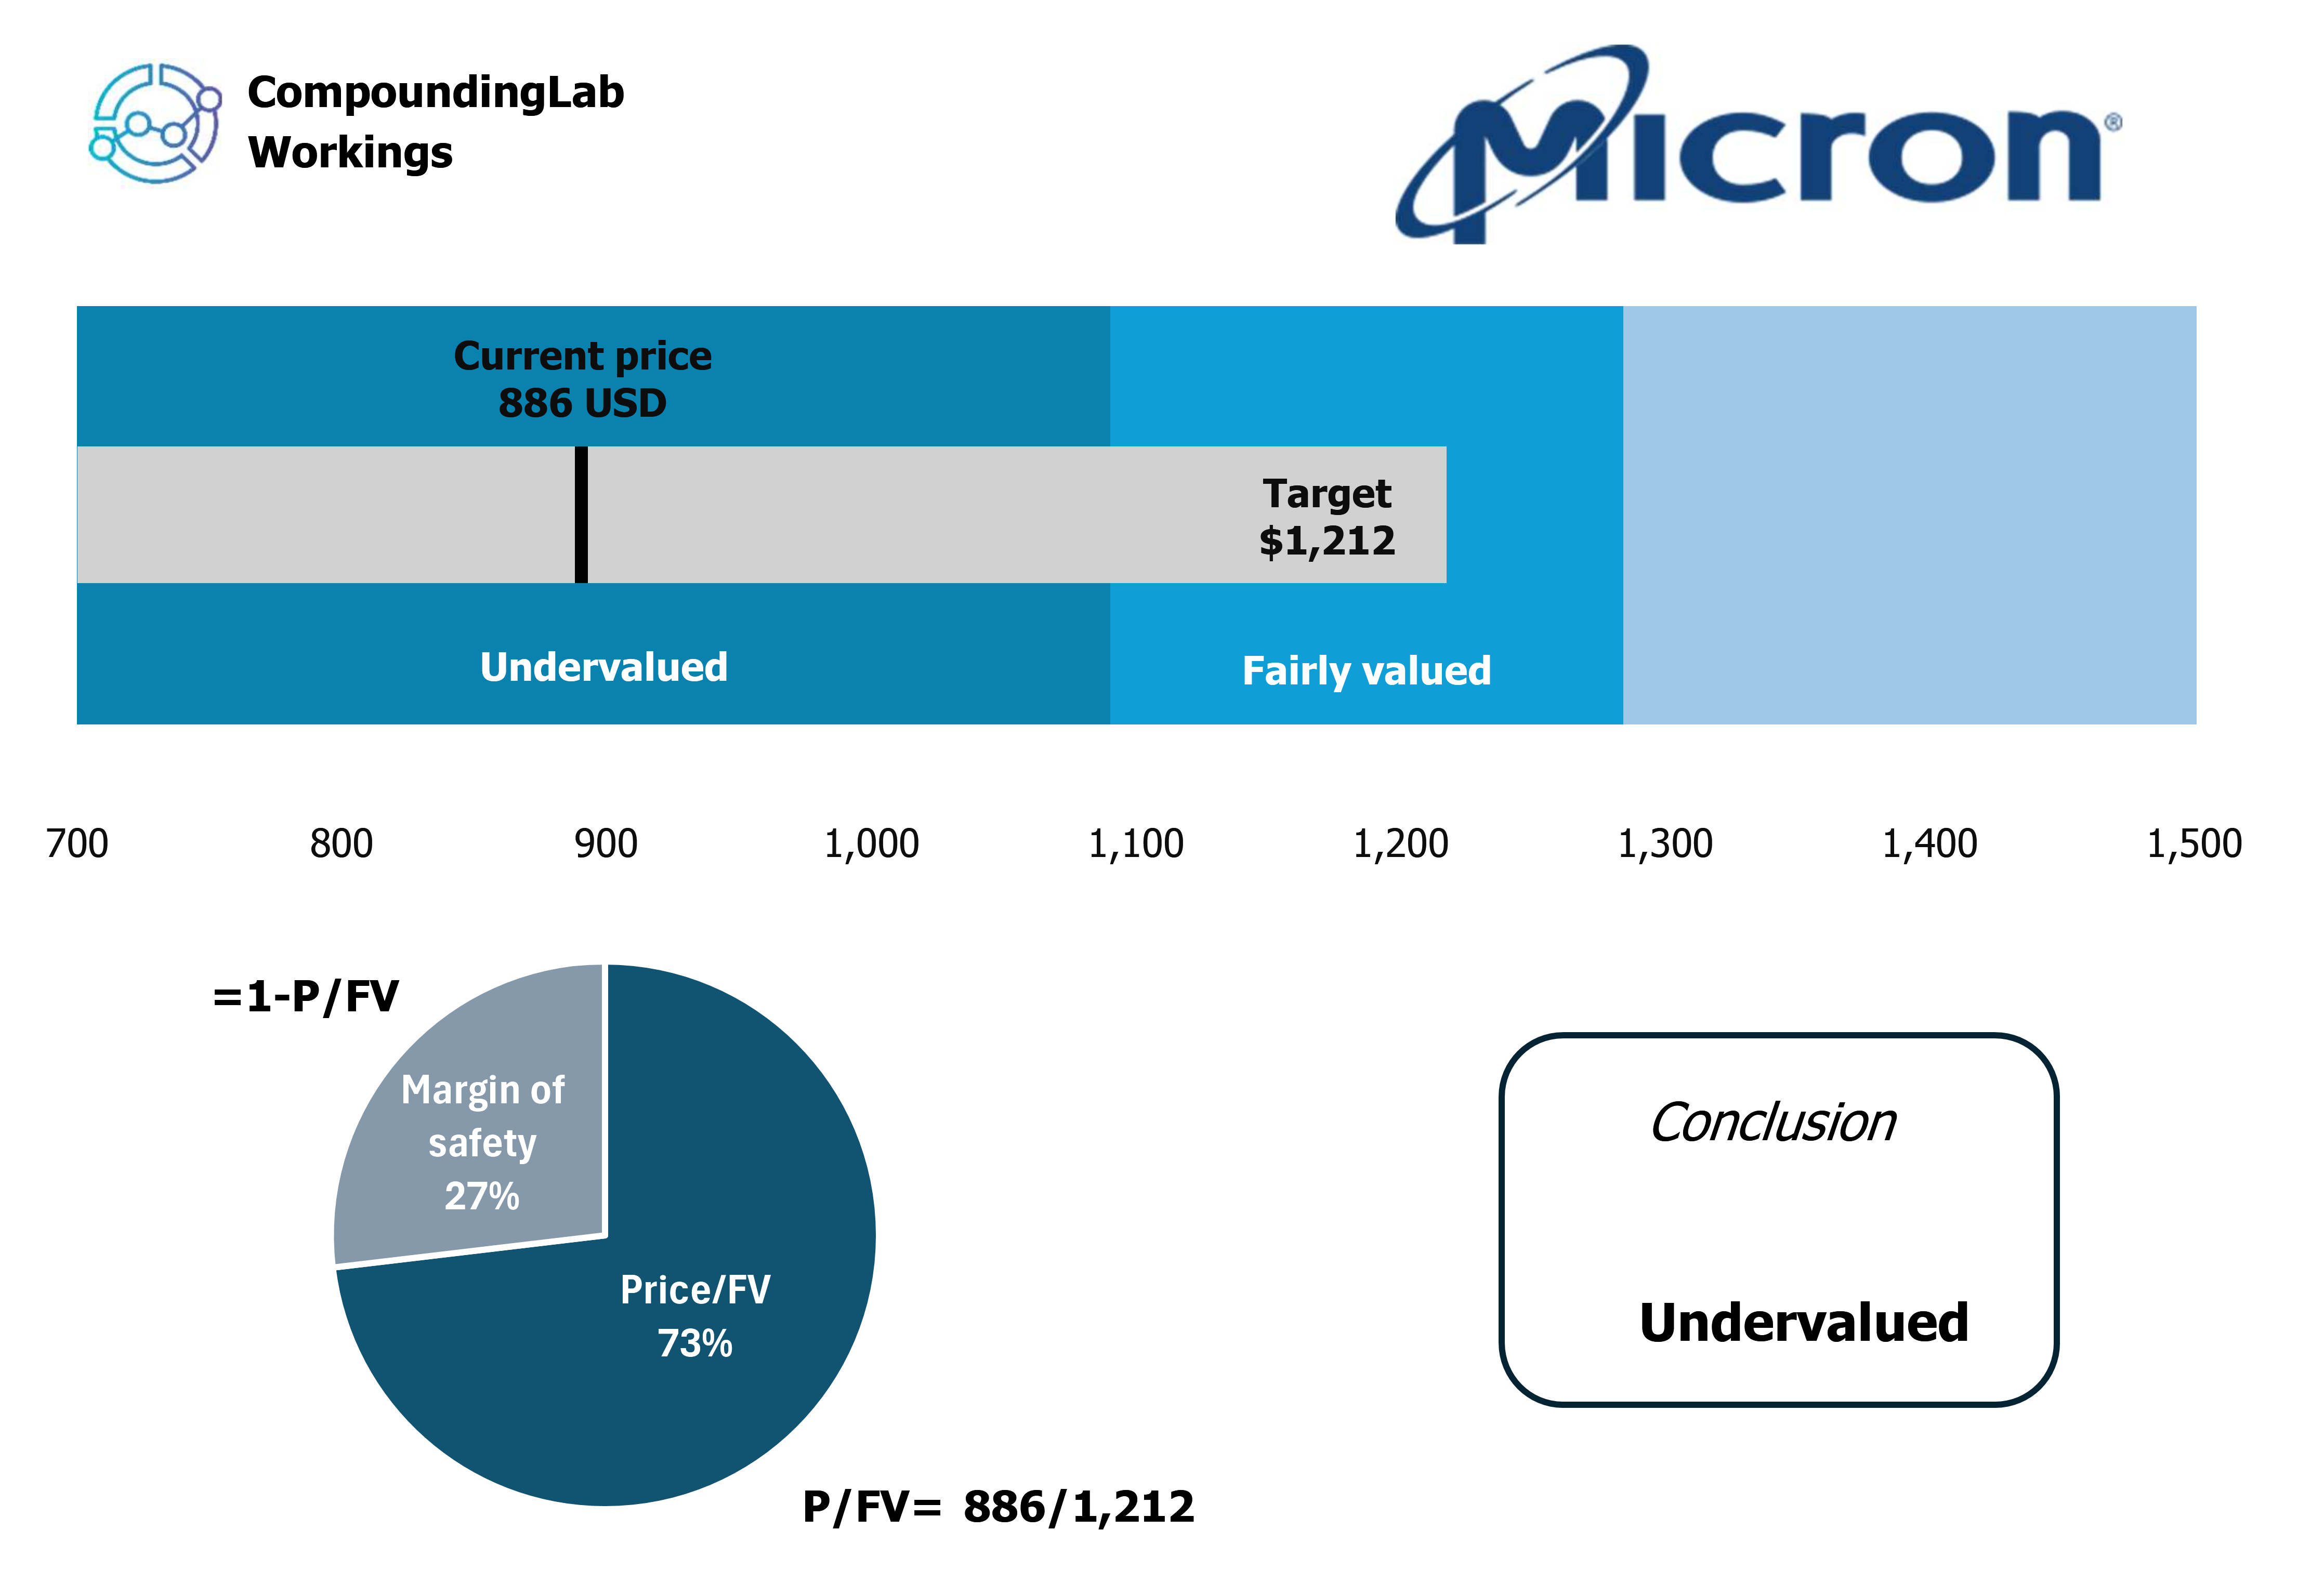
CompoundingLab price target for Micron is $1,212, compared with the current price of $886. That represents 37% upside to fair value, or equivalently a 27% margin of safety measured as 1 minus price divided by fair value.
Several things could make the base case work:
- HBM remains structurally undersupplied. AI accelerators require increasing memory bandwidth and HBM content per system, supporting both volumes and pricing.
- Micron gains share at the high end. Successful execution in HBM and leading-edge DRAM could narrow the gap with larger competitors and improve product mix.
- Wafer-capacity intensity stays elevated. HBM’s larger die footprint and packaging complexity limit effective bit-supply growth even when nominal fab capacity expands.
- Hyperscaler spending remains resilient. Continued investment in training and inference infrastructure can extend the demand cycle beyond what a traditional memory upturn would support.
- Capital discipline survives the boom. If the three major suppliers prioritize returns over market share, the industry may avoid the most destructive form of oversupply.
- Micron converts peak profits into balance-sheet strength. The company already has net cash in my model. Strong free cash flow can fund investment without materially diluting equity holders or increasing financial risk.
None of these outcomes requires the 80% margin to last forever. My base case already assumes a decline to 62.7% by Year 6. The thesis needs the current supercycle to be large and durable enough, not necessarily permanent.
Sensitivity: where the valuation breaks
For prudence purposes, I am sharing my sensitivity workings so readers can choose their own assumptions rather than simply accepting mine.
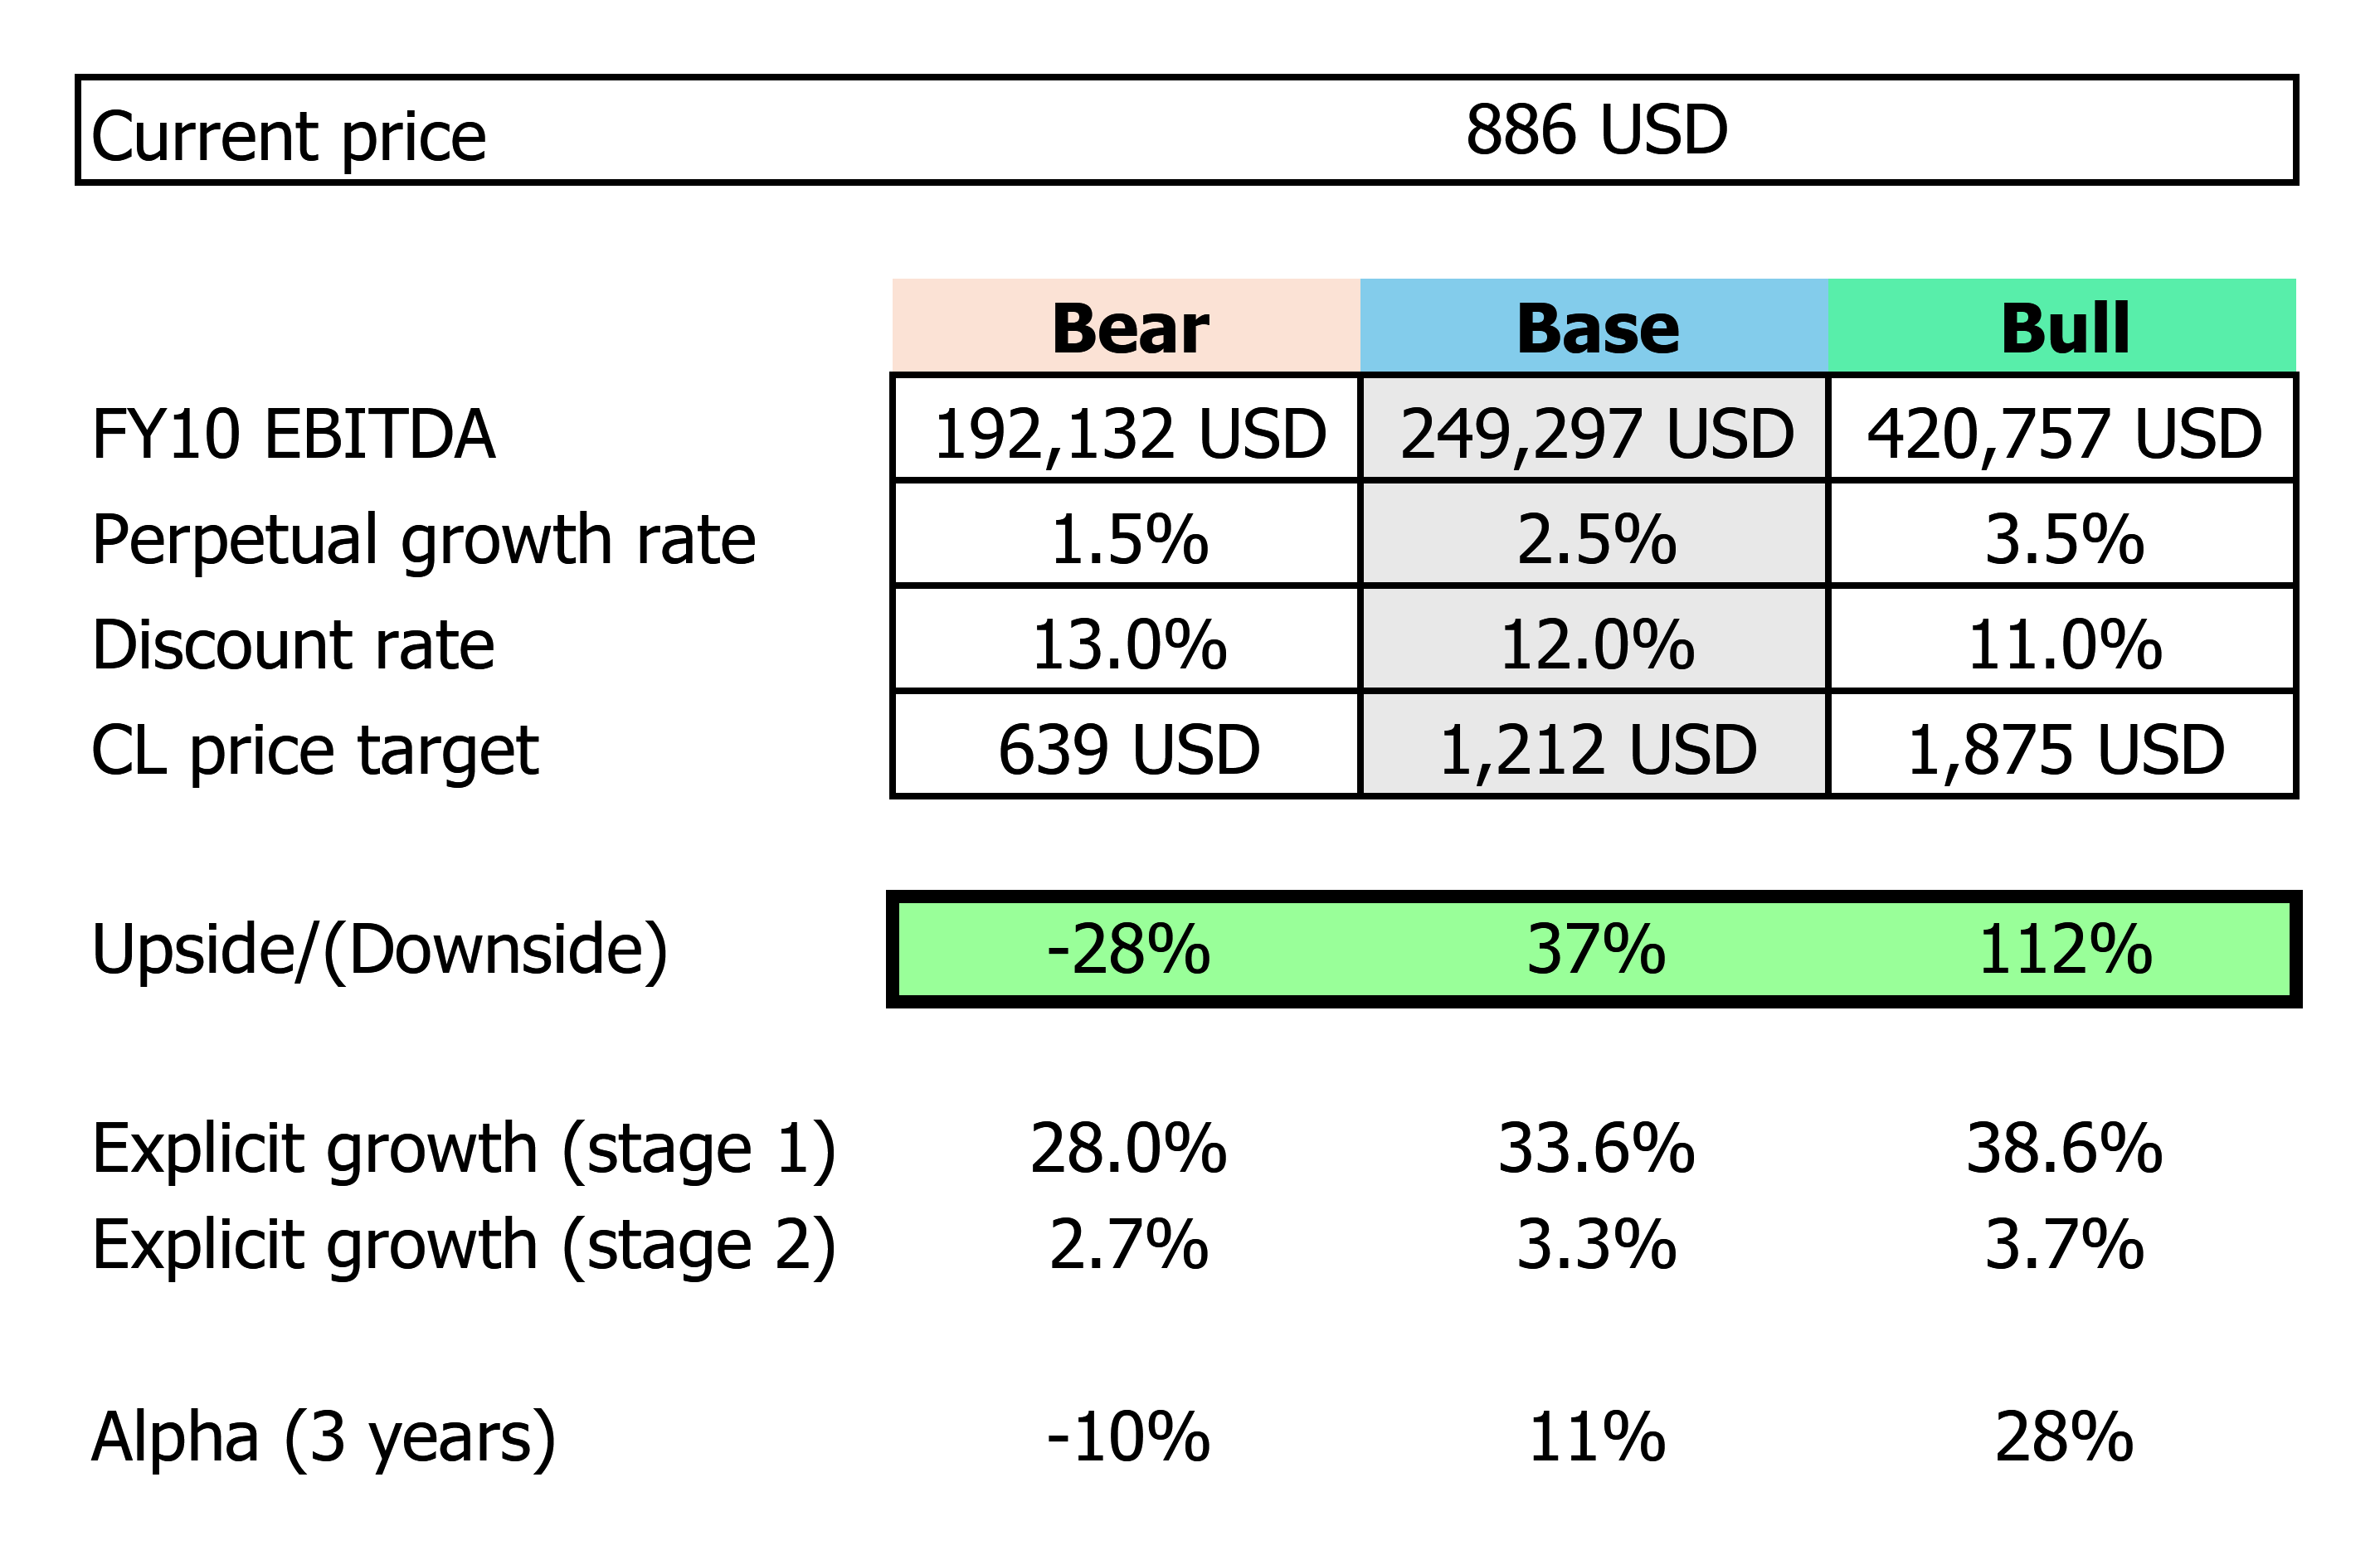
My bear case uses 28.0% Stage 1 growth, 2.7% Stage 2 growth, a 1.5% perpetual growth rate and a 13% discount rate. It produces a fair value of $639, 28% below the current price and equivalent to approximately -10% annualized downside if realized over three years.
My bull case uses 38.6% Stage 1 growth, 3.7% Stage 2 growth, a 3.5% perpetual growth rate and an 11% discount rate. It produces $1,875 per share, or 112% upside and approximately 28% annualized appreciation over three years.
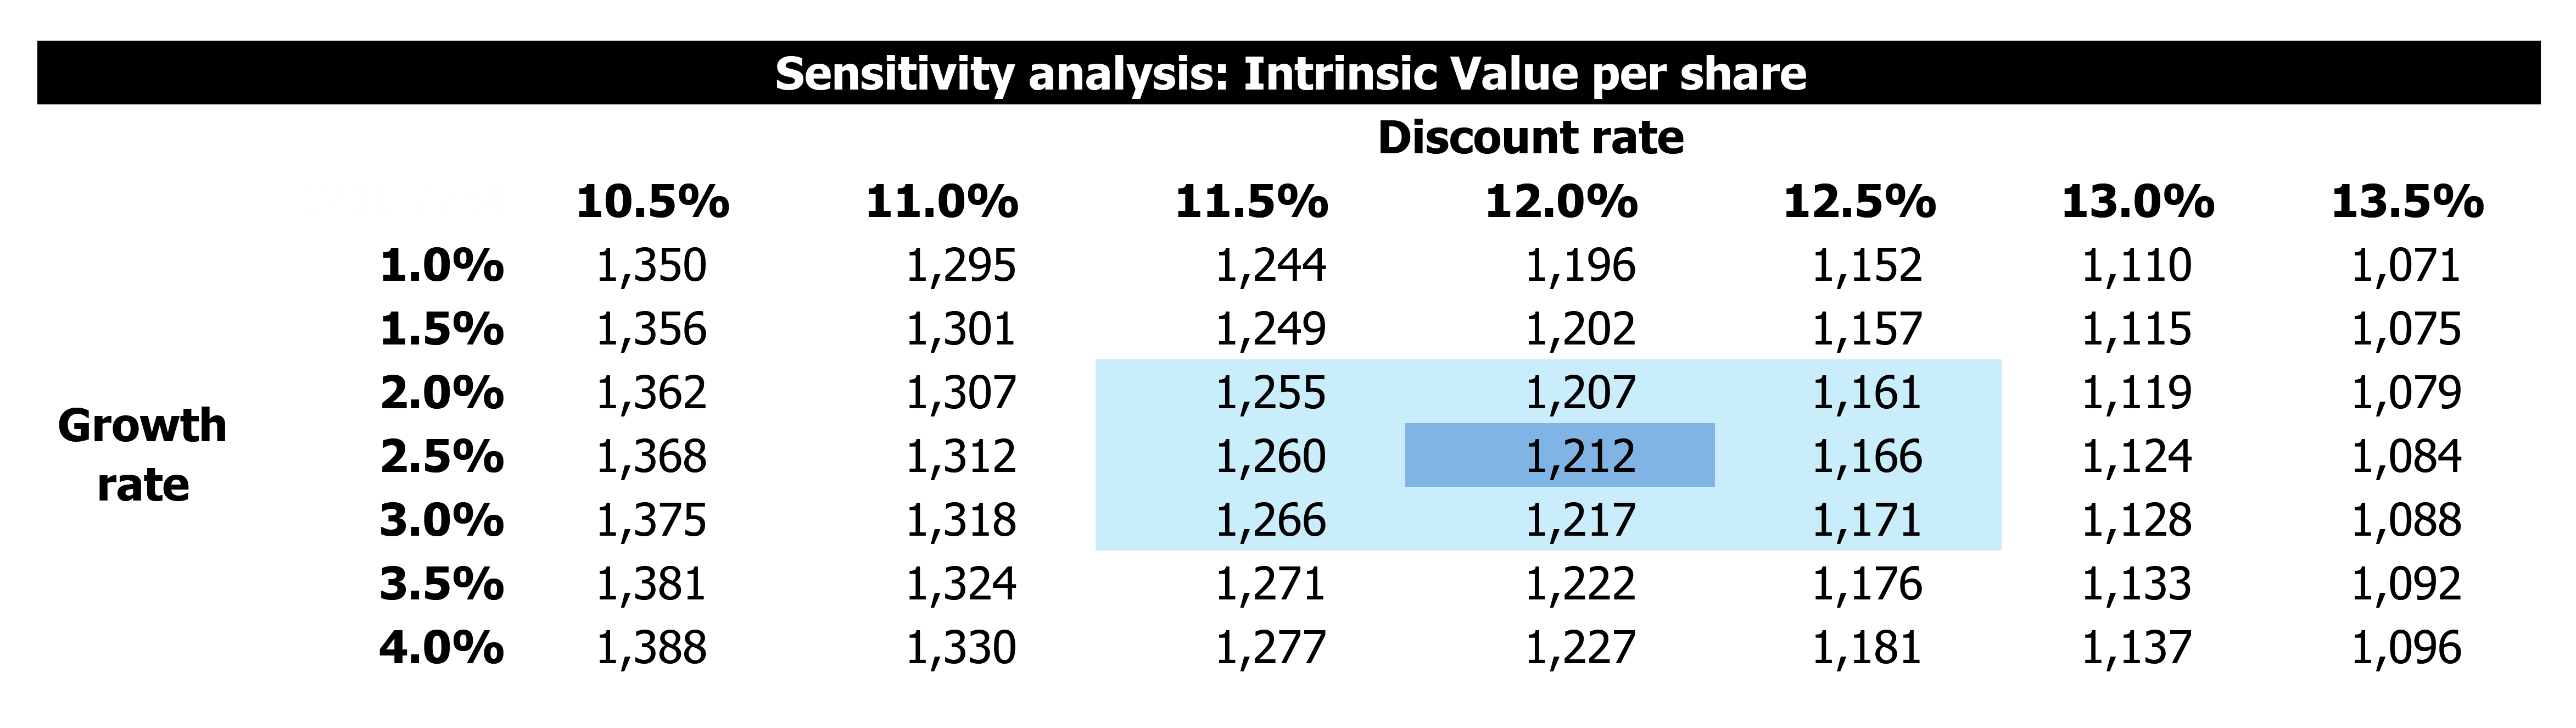
Across perpetual growth rates of 1%–4% and discount rates of 10.5%–13.5%, estimated value ranges from $1,071 to $1,388. In the central zone (11.5%–12.5% WACC and 2%–3% perpetual growth) the result is $1,161–$1,266. The $1,212 base case is not an isolated outcome.
Verdict
My DCF says Micron shares are attractively priced. The current quote of $886 offers a 27% discount to my $1,212 fair value.
But valuation is not the only input in my investment process.
Micron remains a deeply cyclical, capital-intensive business without a durable economic moat. Its current profitability is exceptional, but exceptional margins attract capacity, competition and customer resistance. Small changes in long-run pricing or utilization can produce large changes in free cash flow, even when end-market demand remains healthy.
For that reason, I am not willing to step in at this stage, despite the apparent discount. I would rather miss some upside than underwrite peak-cycle economics in a business whose competitive structure has historically made those economics temporary.
This is my personal valuation work, not financial advice. Keep in mind that this is an estimate - just like any DCF model. I’m not claiming perfection, but I do trust these calculations to assist with my own investments. Hopefully, they can help inform yours as well. Look at it as a thinking tool, not necessarily as a stock-picking tool. If you choose to share it online, please credit my page as the source.
Disclaimer: This post is for informational and educational purposes only. I do not own shares in MU but can buy/sell them at any time after this post is published. Not financial advice. Do your own research.
Follow my Substack for regular actionable investing frameworks, incl. a more detailed DCF.